To view this letter in PDF Format lease click here: 2023-Q3 PBCM Investor Letter.pdf
Welcome to our new investors and thank you to our existing clients and partners for their continued support. We are pleased to present our results for the third quarter of 2023 in the following pages.
After reading this letter, please do not hesitate to contact us if you have any questions, want to discuss any topics in greater detail, or would like to learn more about our Concentrated Value portfolio. We can be easily reached by phone at 239-738-0384 or via e-mail at info@pelicanbaycap.com. We welcome your feedback and look forward to your correspondence. Additionally, we encourage you to share this letter with your friends and colleagues.
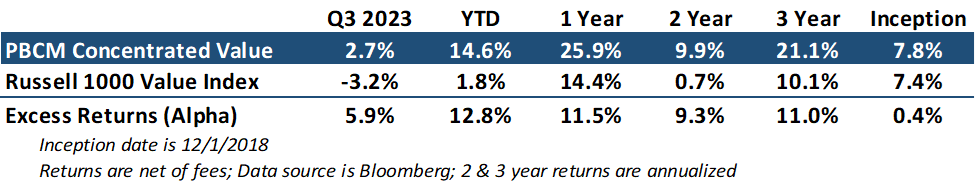
Next month, the Concentrated Value portfolio will celebrate its five-year anniversary. Over this period, we have encountered a variety of market and economic conditions, including three bear markets and two bull markets. Despite these challenges, we are proud to report that we have delivered solid relative and absolute returns, well above our highest expectations when we launched the firm.
Of course, past performance is not indicative of future results. But we believe that our investment philosophy of buying high-quality stocks with better profitability, less-levered balance sheets, and cheaper valuations than the benchmark has given us the opportunity to deliver excess returns.
As the table below shows, the portfolio continues to be defined by these characteristics. Our companies have higher profit margins, higher returns on invested capital, higher dividend yields, and less financial leverage. Yet they trade for an average price-to-earnings (PE) multiple of just 13.4x forward earnings, much less than the 17.6x forward multiple of the Russell 1000 Value Index.
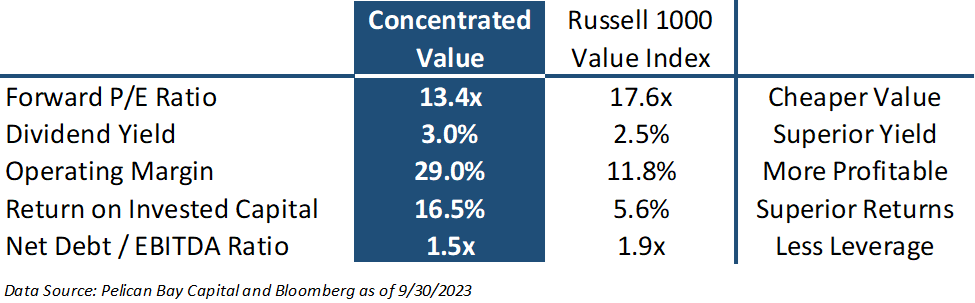
A big advantage of owning companies with these characteristics is that they often fall less than the benchmark in declining markets. However, we believe that higher-quality companies should ultimately sell at valuation multiples that are comparable to or even greater than the benchmark.
Assembling a concentrated portfolio of stocks in companies that we believe are higher quality, but trade at a discount to the benchmark, should over time see their valuations rise as they close the discount. This narrowing of the discount to the benchmark is the investment opportunity and gives us a better chance of delivering attractive returns in the medium and long term.
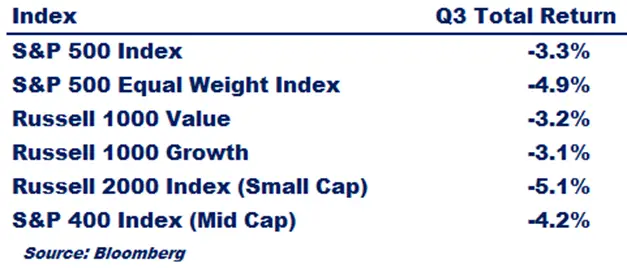
In general, stocks saw modest declines in the third quarter, reversing some of the large gains in the second quarter. Returns for the major stock indices were remarkably consistent with declines between -3.1% and -5.1% (see table below). This tight cluster of returns across both market cap classifications and value/growth factors was in sharp contrast to the first half of 2023, when large-cap growth stocks outperformed other stock indices by a significant margin.
The Concentrated Value portfolio returned a positive 2.7% in the third quarter, outperforming the Russell 1000 Value Index by 589 basis points, or 5.89%. This strong relative performance added to the portfolio’s solid results in the first half of the year, increasing its year-to-date alpha relative to its benchmark to 1,281 basis points, or 12.81%.
The primary factor driving the portfolio’s positive results in Q3 was the buyout offer made by Tapestry (TPR) for Capri Holdings (CPRI). Under the terms of the merger agreement, Tapestry is paying shareholders $57.00 per share in cash. Prior to the announcement of the offer, shares of CPRI were trading for $35. The stock price jumped 56% to $53 on the day of the announcement. Fortunately, we believed that CPRI was significantly undervalued, and we happened to add to our holdings in the company only days before the merger offer, making it the portfolio’s largest position.
The Concentrated Value portfolio also benefited from strength in its energy positions as well as financials. Companies in the industrial and telecommunications sectors were the largest detractors to performance.
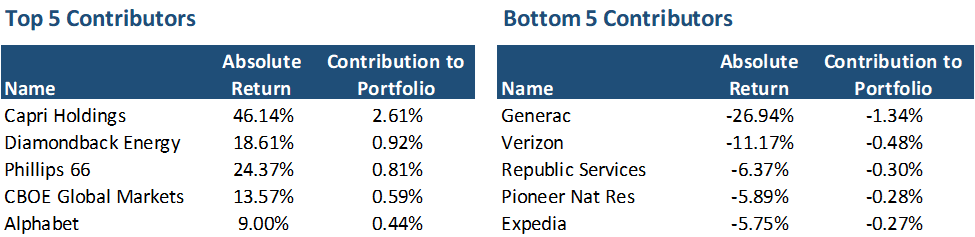
Generac (GNRC) is one of the newer names in the portfolio, with our first purchase in January. The company is still overcoming its elevated inventory of standby generators that hurt profitability in 2022. Investors were disappointed that the company was still correcting this issue, and shares dropped by 24% after releasing quarterly earnings. This decline reversed the large gain in share prices over the prior quarter. On a subsequent analyst day meeting, the company reported that inventories are now normalized, and the company will return to growth and higher profitability in 2024.
Our investment case in Generac remains unchanged. We believe the end market for home standby generators should grow faster than GDP over the next decade as black-outs and power grid reliability continues to deteriorate. Generac has built a commanding market position in generators with a strong brand name and an unmatched dealer network of salesmen and installers. We believe the company can grow earnings at a 10-15% rate as revenues increase and operating profit margins return to historical levels near 20%. We think Generac’s management team has a credible plan to meet these targets.
Verizon’s (VZ) share price continues to struggle, and the company once again found itself on the portfolio’s list of biggest detractors. The company’s fundamentals remain strong as it continues to throw off significant free cash flow as it nears completion of the buildout of its 5G infrastructure. We continue to expect normal earnings power of $4.50-$5.00 per share for the next several years.
The current share price of $32 is a conundrum to us. This represents a valuation multiple of just 6.8x earnings. We believe this low multiple would only make sense if investors were expecting the business and profitability to collapse. We think this is very unlikely to happen, and consensus estimates are similar to our views and predict growing earnings in the next 4 years. It is very hard to imagine a scenario where profits could materially shrink as the wireless industry is a three-player oligopoly with moderate pricing power, providing a critical service to customers. Given interest rates, and the durability of Verizon’s cash flow, we believe a 10-14x multiple is more appropriate. We are happy to collect an 8% dividend yield while we wait for shares to close the gap from their current multiple.
Oil prices rose by 32% in the third quarter as global oil demand continues to run 1-2 million barrels per day ahead of supply. In fact, in July oil demand reached a new record high of 103 million barrels per day. Years of underinvestment outside of the US shale patch has resulted in steady decline in non-US oil production. Prolonged production cuts by Saudi Arabia and OPEC, combined with lower-than-average oil inventories has been a recipe for higher prices.
Given the multi-year time frames needed to bring on new supplies, combined with environmental policies designed to constrain new oil investment, we believe oil prices could continue to rise for the foreseeable future.
Diamondback Energy (FANG), an oil producer with significant acreage in the Permian Basin, saw its shares increase 19% in the quarter. Phillips 66 (PSX), an oil refiner, rose in sympathy with oil prices as refining margins increased substantially in the third quarter.
PSX has had an excellent run and remains attractive should refining margins be sustained at current levels of $30 per barrel. This is well ahead of $10-$16 per barrel margins that were considered normal prior to the pandemic. There have been structural changes that suggest this margin could persist, such as a shortage of diesel fuel relative to gasoline and the closure of refining capacity in the US following the Pandemic and in Europe following the Ukraine war. The discount of US natural gas prices to global natural benchmarks has also contributed to the spread.
However, we believe market forces will ultimately result in the refining margin shrinking from a record level back towards historic rates that represent reasonable return on capital. We believe that over time US natural gas prices will converge with international prices as the US builds more LNG export capacity, that will increase refining operating costs.
Additionally, we believe oil prices are headed much higher in the near to medium term as our analysis indicates that global oil demand should exceed oil supply, while at the same time global oil inventories are at record low levels. It is our belief that the Biden Administration’s sale of 300 million barrels from the Strategic Petroleum Reserves (SPR) masked the bullish shift in oil fundamentals.
As you can see in the chart below, the more widely followed Commercial Crude Oil Inventory excluding the SPR (red line – right axis) is at levels that are consistent with pre-pandemic range. However, when we observe Total US Oil Inventories that includes oil barrels the SPR (white line – left axis), we see that inventories are down substantially, to levels not seen since 1984. Because the generally aren’t major movements in the SPR inventory, most strategists and investors have historically ignored the Total US Oil Inventory measure in favor of the Commercial Crude Oil Inventory data.
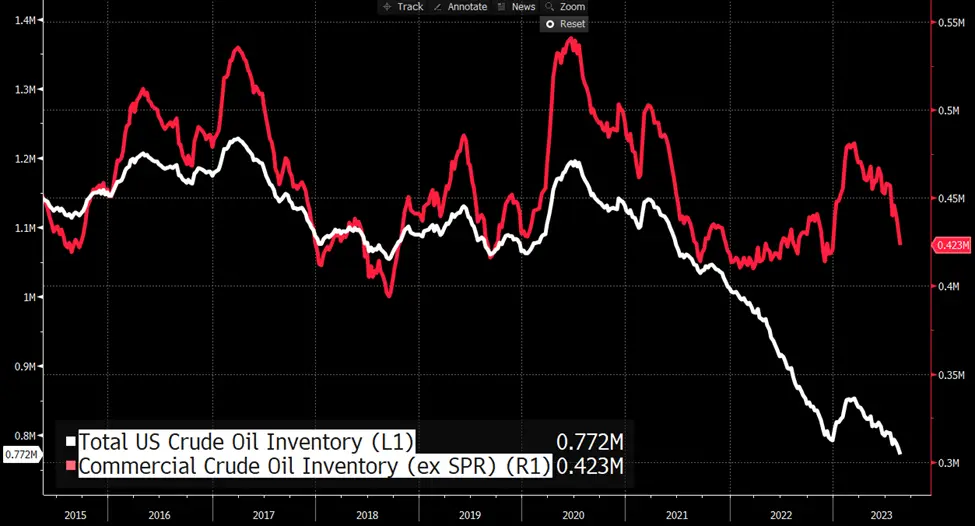
Source: Bloomberg
If the Biden Administration did not sell 300 million barrels of oil from the SPR, Commercial Inventories would be at 123 million barrels instead of the current 423 million level. We believe that most market participants would view any Commercial Inventory reading below 200 million barrels as a crisis and oil prices would be significantly higher.
Now that the Biden Administration is done selling from the SPR, and the oil market remains undersupplied, Commercial Crude Inventories should decline rapidly (and they have been). When oil prices increase rapidly, refining margins typically compress, and share prices of refining companies decline. This is because in a rising oil price environment, crude oil prices tend to increase faster than gasoline or diesel prices. Effectively, refiners’ input costs rise faster than finished goods prices and margins decline.
When we observe prior periods of rapidly increasing crude oil prices, refiners tend to decline while traditional E&P companies see share price gains. Thus, we have made the decision to keep our total energy exposure flat and swap our position in PSX for a new position in Pioneer Natural Resources (PXD), a large shale oil company that is the dominant producer in the prolific Permian Basin.
Additionally, PSX was trading near the upper end of our valuation range of $75-$130 per share. We sold our shares of PSX for $117 per share, representing a total return of 121% since our initial purchase.
We rolled the proceeds from PSX into a new position in Pioneer Natural Resources (PXD). That company is the second largest shale oil producer in the US and the largest land acreage holder in the Permian Basin, most of which is considered highly productive “Tier 1” acreage. The company has some of the most productive wells in the country that cumulatively produce approximately 370,000 barrels of oil per day and 800 million cubic feet of natural gas. At current oil prices and levels of production, PXD has more than a decade of reserves remaining.
PXD is one of the lowest cost operators in the Permian basin with cash operating costs of $10.50-$12.00 per barrel. We believe this cost can come down further as PXD expands the lateral length of their horizontal wells from 10,000 ft to 15,000 ft. Management has identified more than 1,000 future drilling locations where they own enough contiguous acreage to drill 15,000 foot laterals (3 miles in length).
Given current commodity prices, the company is printing money and is redirecting this cash back to shareholders with a policy that returns 75% of free cash flow directly to stockholders through a base dividend of $1.25 per quarter, a variable dividend, and share repurchases.
In just the last two years, PXD has paid out $9.75 billion in dividends ($40.30 per share) and repurchased $2.6 billion of shares. Over the next five years, we believe PXD can generate between $25-$40 billion of free cash flow at oil prices of $80 and $100 per barrel respectively. This compares to their current market cap of $56 billion. Given their cash return policy, we believe PXD can support a dividend yield of over 8% annually.
PXD also has an excellent balance sheet with just $5.2 billion of net debt or 0.5x net debt/EBITDA. Only $3 billion of this debt matures prior to 2030. The company also has $1.8 billion of availability on their unsecured credit facility for any extra liquidity needs.
Given our forecast for oil prices of $75-$100 in the medium term, we believe PXD can generate $19-$32 in normal earning power. Applying a 12x-14x price-to-earnings multiple, we believe shares are worth $260-$380, and potentially much more should the oil prices rise above $100 per barrel. We initiated our position at $244 per share.
Unfortunately, the management team at Exxon Mobil saw that shares were undervalued too, and after the quarter they agreed to merge with PXD for consideration of XOM shares currently worth $264. Please note the purchase price will fluctuate with XOM’s share price.
This offer price represents a small premium to our purchase price and is at the lower end of our estimate of fair value. While the quick gain represents a very nice return on an annualized basis, we would have preferred to realize an outcome at the upper end of our valuation range.
We are in the process of evaluating another energy company with more upside to replace PXD in the portfolio, and we look forward to updating you in our Q4 letter.
Lastly, we wanted to revisit the Investment Philosophy of the Concentrated Value portfolio. We utilize a value investment strategy that seeks out companies for investment which the Portfolio Manager deems to be high quality companies. Quality is defined by possessing business operations with durable competitive advantages, allowing for high returns and growing cash flows streams. We want these high-quality companies to also have solid balance sheets, preferably with a net cash position. We also prefer that their management teams make decisions with an emphasis on maximizing shareholder returns.
Once we find these high-quality companies, we generally only invest in their stock if they trade at a steep discount to our estimate of their intrinsic value. This is necessary to provide our investors with the opportunity to generate an above market return and protect capital. This discipline creates a wide margin of safety if an undesirable scenario plays out in the future. Pelican Bay Capital Management believes that identifying a significant difference between the daily market value of a security and the intrinsic value of that security is what defines an investment opportunity.