To view this letter in PDF Format lease click here: 2023-Q2 PBCM Investor Letter.pdf
Welcome to our new investors and thank you to our existing clients and partners for their continued support. We are pleased to present our results for the second quarter of 2023 in the following pages.
After reading this letter, please do not hesitate to contact us if you have any questions, want to discuss any topics in greater detail, or would like to learn more about our Concentrated Value portfolio. We can be easily reached by phone at 239-738-0384 or via e-mail at info@pelicanbaycap.com. We welcome your feedback and look forward to your correspondence. Additionally, we encourage you to share this letter with your friends and colleagues.
As you can see from our address on the letterhead above, our firm is headquartered in beautiful Naples, Florida. While there are many wonderful advantages to living in Naples, one downside is that our region of the country is frequently threatened by hurricanes. In the last 20 years alone, our area has been struck by three named storms.
Going through a hurricane can be a frightening and unforgettable experience. As the hurricane makes landfall, the wind continues to accelerate in series of surging gusts that howl ever louder. The power flickers incessantly before finally going out for good, plunging your house into darkness and with it your connection to the outside world and any information about the storm’s progress. It is an exhausting and disorienting experience that builds up over several hours.
Then without warning, the wind quickly dies down, everything goes silent, and bright light filters through the small gaps in the storm shutters. You open the front door and walk outside to a perfectly beautiful day with sunny skies and calm weather. The transformation in conditions from just 10 minutes prior couldn’t be more striking. This is the eye of the storm and can often be 20-60 miles wide.
Emotionally, you are overcome with an overwhelming feeling of relief as your anxiety dissipates and for the first time it feels like everything is going to be okay. Your mood lightens and there is a return to a sense of normalcy. It is easy to forget that the hurricane isn’t over yet, and this is just a temporary reprieve. The back half of the storm is slowly approaching on the distant horizon.
For investors, the last year and a half has been like an economic hurricane. Stocks plunged into a bear market in January 2022. We endured crippling inflation that peaked at 9.1% annualized. The Federal Reserve responded by increasing interest rates by 5%, a level few could have imagined back in 2021. In just the last few months there have been several negative shocks including a bank panic and a debt-ceiling showdown that took the US to the brink of default. Additionally, over this entire period the economic data has steadily deteriorated, resulting in the persistent threat of a looming recession.
Nevertheless, it seems to us that the negative market sentiment that consumed investors since the beginning of 2022 has shifted rapidly since mid-May. Investors have promptly turned incredibly bullish if not downright euphoric. Economists are quickly abandoning their recession forecasts as the elusive soft-landing is now suddenly considered the base case.
Circling back to our hurricane metaphor, it is as if investors have broken through the “eye wall” of the bear market and into fairer weather, and all they see now is smooth sailing. Certainly, the second quarter’s strong equity performance has been a welcome reprieve from 2022’s losses. However, this feeling that we somehow got away with it may prove illusionary, and a resumption of the bear market may potentially lie ahead.
Frankly, we are concerned that the shift of market sentiment has gone too far, too fast, and the recovery in equity prices doesn’t match the underlying fundamentals. We are seeing evidence of investor speculation and euphoria on par with some of the silliness we witnessed in 2021, just before the market top.
For example, there has been a significant increase in the price of stocks that we would describe as “speculative”. The UBS Profitless Tech Index is up 61.8% and the Goldman Sachs Most Shorted Index has climbed 38.9% year to date. Even Meme stocks have rebounded sharply. The Roundhill Meme Stock Index jumped +65.3%. These outsized gains have left conservative investments like value stocks in the dust. By comparison, the Russell 1000 Value Index is up just 5% through June 30th.
The speculative frenzy has not been contained in lower-quality small-cap stocks. We have seen the mega-cap stocks surge even further. Collectively, Apple, Microsoft, Alphabet, Meta, Amazon, Tesla, and Nvidia are now being referred to as the “magnificent seven”. This group has returned 72% year to date.
In our opinion, valuations for many of these mega-cap stocks are becoming stretched and appear to be pricing in not just a soft-landing, but a significant acceleration in economic growth and earnings power. Combined, the average P/E ratio of the “magnificent seven” is now 42x expected earnings. In the case of Nvidia and Tesla, their valuations are unjustified even under the most favorable business forecasts we can dream up.
These “magnificent seven” stocks have by themselves resulted in large gains in widely quoted market indices such as the Nasdaq and S&P 500; up 32% and 17% respectively in the first half of 2023. These rebounds have been large enough to encourage many media pundits and strategists to declare an “official” end of the bear market. Unsurprisingly, there are unmistakable signs of fear of missing out or “FOMO” amongst many investors.
Our concern is that the substantial weight of the “magnificent seven” stocks in the S&P 500 Index is contributing to making the entire S&P 500 Index, and by proxy the stock market, appear overvalued. Any reversal in the mega-cap tech stocks back to reasonable valuation levels could lead to substantial drawdowns in the S&P 500 and Nasdaq.
Of course, this doesn’t mean that all stocks are overvalued, or represent poor investments. Quite the contrary. Periods of speculative excess such as these can often leave behind high-quality companies at attractive valuations, and more importantly, the opportunity to earn very attractive returns on both a relative and absolute basis.
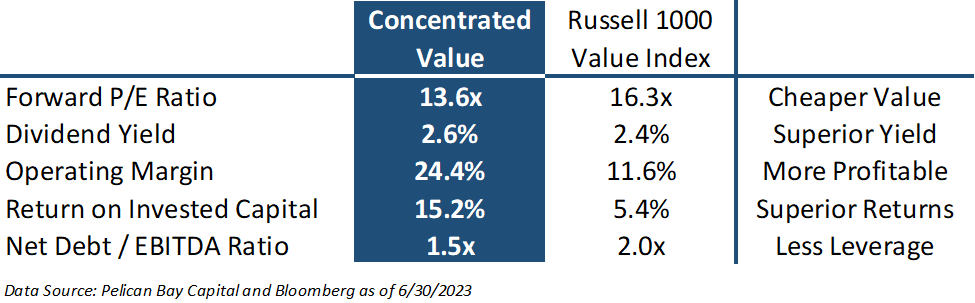
It is these types of companies we seek to invest in when deploying capital in the concentrated value portfolio. As you can see in the table below, when compared to the Russell 1000 Value Index the Concentrated Value portfolio has cheaper companies with higher profit margins and returns on capital and less leverage. We believe that constructing a portfolio with these superior attributes should give us a better chance to deliver attractive returns in the medium and long term.
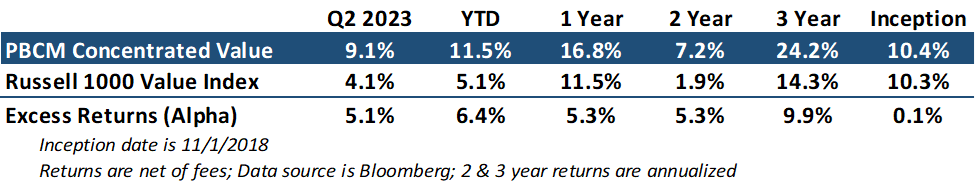
During the second quarter, the Concentrated Value portfolio returned 9.12% and significantly outperformed the Russell 1000 Value Index by 505 basis points, or 5.05%. The strong relative performance in the second quarter added to our solid results in the first quarter, increasing our year-to-date alpha relative to our benchmark to 644 basis points, or 6.44%.
The primary factors that drove our positive results in Q1 carried into the second quarter with many of the same stocks leading our list of top contributors. Like the first quarter, the Concentrated Value portfolio benefited from strength in the Consumer Discretionary and Industrial sectors. Basic Materials and Energy sectors were the largest detracted to our performance. Below is a table with our top five and bottom five contributors to our return for the quarter.
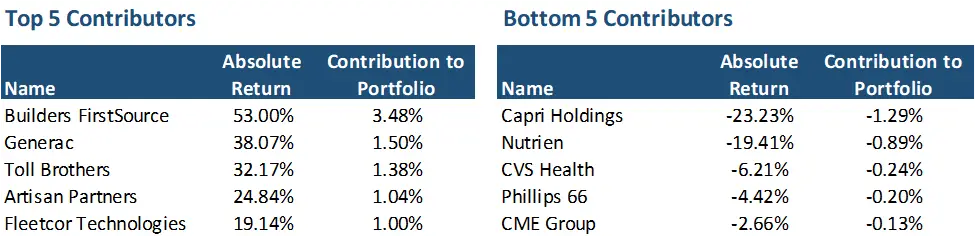
Our biggest winners this quarter were home builders and related stocks. Builders FirstSource (BLDR) was our best performer for the second quarter in a row. The shares have appreciated by 124% since our original investment this time last year. Subsequent to the quarter end we had to trim our position back to a 6% weight from 9%. At $140 per share, the stock price moved into the upper half of our estimated range of intrinsic value. We believed it was prudent to scale back its outsized influence on our portfolio. We estimate the intrinsic value of BLDR is as high as $170 per share, so there is still plenty of room for the stock to appreciate further. Even after taking some gains off the table, the stock remains a top 3 holding.
Toll Brothers, Artisan Partners, and Fleetcor Technologies were also on our list of top 5 contributors in the first quarter. Toll Brothers (TOL) rose along with the entire homebuilder sector as home prices and units under construction continue to rise despite elevated interest rates. Homebuilders are benefiting from a record low inventory of existing homes as high rates have discouraged homeowners with 3% rates from wanting to move. Homebuilders are also benefiting from the ability to buy down mortgage rates to 4-5% in leu of offering traditional incentives such as luxury finishes or bonus rooms. This makes buying a new home more attractive than having to take a 7% mortgage to purchase an existing property. Homebuilders in general continue to trade for reasonable valuations, and we believe Toll Brothers remains undervalued despite their recent gains.
Artisan Partners (APAM) rose in sympathy with the market as Assets Under Management (AUM) for the investment manager increased 12% in the first half of the year. We believe that APAM should be able to generate normal earnings power over the next few years of $4-$6 per share which would result in an intrinsic value of $48-$84 per share. With the rebound in AUM this year, APAM is well on their way to realizing normal earnings power. At $42 the stock remains attractive.
Generac (GNRC) is the only new addition to this quarter’s list of top 5 contributors. It is one of our new holdings as we made our initial investment in January at $106 per share. The company has been able to resolve their excess inventory and field installation issues faster than many expected, including ourselves. The stock has rebounded to $147 from a very depressed price. Please see our Q1 2023 letter to learn more about our investment case for GNRC.
Looking at our detractors for the quarter, Capri Holdings (CPRI) was once again in the mix. The stock fell after reporting weaker than expected Q1 earnings as cautious wholesale customers such as US-based department stores reduced inventory levels ahead of a potential pullback in consumer spending. At a current share price of $36, CPRI is one of our favorite investment ideas and after the quarter we took the opportunity to increase our holdings. The company currently trades for just 6x earnings and a 13% cash flow yield. Similar luxury retailers sell for significantly higher prices. We would not be surprised to see a private equity firm or strategic buyer make a bid for the company.
The only other laggard of consequence this quarter was Nutrien (NTR). The company also had a disappointing quarter as farmers held back on fertilizer purchases and pricing for potash and nitrogen fell. We believe the declines in fertilizer pricing will be temporary as farmers can only delay applications for so long and supply remains constrained because of the war between Russia and Ukraine. As agriculture prices continue to rise and farmers are incentivized to increase yields, fertilizer demand should rebound along with NTR’s stock price.
Turning to activity in the quarter, in addition to adding to our position in CPRI we also increased our investment in FleetCor (FLT) as their business turnaround continues to gain steam. We trimmed our stake in Phillips 66 (PSX) as we were concerned that we were seeing early signs that refining margins are beginning to normalize to lower levels. While our investment case in PSX has incorporated lower refining margins, the stock could possibly selloff none the less as other investors react to incremental changes regardless of fundamental values. Should that occur, we would use the opportunity to add back to our position.
We exited our position in Liberty Media Corp – Braves (BATRA). Our investment in the Atlanta Braves was a success as the company rebounded nicely from their lows during the depths of the covid pandemic when we made our initial purchase. Shares rallied to the top end of our fair value estimate ($42 per share) after the Liberty Media Group announced they were spinning off the Tracking Stock for the Braves into a separate corporate entity.
We redeployed the proceeds from our sale of BATRA into a new position in Expedia Group (EXPE). Expedia is the second largest online travel agency (OTA) and operates multiple websites and apps under the Expedia, Hotels.com, Orbitz, Hotwire, Travelocity, and VRBO brands. Expedia offers customers a one-stop-shop platform for booking flights, hotels, car rentals, cruises, and other travel activities. They make money on a commission for these services as well as advertising dollars from vendors seeking premium positioning on their websites.
Expedia primarily competes against Booking.com which operates under the Priceline, Booking.com, Kayak, and OpenTable Brands. With revenues of $18 billion Booking.com is approximately 50% larger than Expedia ($12 billion in Revenue). Over the last two decades Expedia and Booking.com have acquired most of the competing OTA’s in the marketplace.
Expedia’s VRBO vacation rental business primarily competes against AirBNB and hundreds of smaller mom-and-pop local rental agencies. VRBO is the market leader in vacation homes rentals. However, the company doesn’t offer individual rooms for rent or hosted accommodations which is a market dominated by AirBNB.
Expedia is poised to benefit from several long-term tailwinds. First, the entire travel industry is benefiting from a rebound in business and leisure travel. Travel spending is expected to eclipse 2019 levels in 2023 and grow at a 5-9% growth rate through the rest of the decade.
Second, Expedia has just completed a major restructuring of their tech stack where they have migrated all their websites onto a single shared technology platform. This will allow Expedia to offer every accommodation option across all their websites. This also includes making VRBO listings available on Expedia.com and Hotels.com. This will improve the customer experience by offering more options and should boost revenues. When Hotels.com migrated onto the platform they saw a 20% lift in gross bookings. VRBO will be on the platform later this year.
The new platform will also deliver significant savings through a reduction of duplicate IT spend. Operating margins could expand by as much as 4% from this project. Management is guiding to EBITDA margins of 20% plus in the next few years, compared to a 14-16% range prior to the pandemic.
Expedia should be able to reinvest a portion of these cost savings into more advertising spend, which should lead to higher market share and revenue growth. The improved margins will also help close the gap between the competition as both Booking.com and AirBNB have EBITDA margins in the 30-35% range. We believe some of the valuation discount relative to their peers is due to a lower operating margin at Expedia.
Lastly, Expedia just launched a Loyalty Rewards platform a few days ago. It will be the first multi-brand loyalty program in the OTA industry and could also help drive higher revenues and lower customer acquisition costs.
Expedia has an excellent balance sheet with a net debt-to-EBITDA ratio of 0.3x. The company issued $3 billion of debt and $1.5 billion of stock and suspended their dividend during the early phases of the pandemic. They have subsequently paid off $2.1 billion of that debt, and over the last 3 quarters management has taken advantage of the recent weakness in the stock price to repurchase $961 of stock.
The company generates substantial free cash flow which we believe should be between $2.5-3.0 billion per year. Expedia benefits from a negative cash conversion cycle as they get paid about 6x faster than they pay out travel industry suppliers. We expect Expedia to be in a net cash position by the end of the year and reinstate their dividend. With a current market cap of $15.8 billion, the current share price represents a very attractive 16% free cash flow yield.
We believe the normal earnings power of Expedia is in the range $9.00-$12.50 per share. Given the industry’s improving business model and profitability, along with their strong cash flow and balance sheet strength, we believe that EXPE should trade closer to a market price-to-earnings multiple of 15-17x (Booking.com and AirBNB trade at 20x and 30x respectively). This would result in an intrinsic value of $135-$210 per share. We acquired Expedia for $98 per share.
Lastly, we wanted to revisit the Investment Philosophy of the Concentrated Value portfolio. We utilize a value investment strategy that seeks out companies for investment which the Portfolio Manager deems to be high quality companies. Quality is defined by possessing business operations with durable competitive advantages, allowing for high returns and growing cash flows streams. We want these high-quality companies to also have solid balance sheets, preferably with a net cash position. We also prefer that their management teams make decisions with an emphasis on maximizing shareholder returns.
Once we find these high-quality companies, we generally only invest in their stock if they trade at a steep discount to our estimate of their intrinsic value. This is necessary to provide our investors with the opportunity to generate an above market return and protect capital. This discipline creates a wide margin of safety if an undesirable scenario plays out in the future. Pelican Bay Capital Management believes that identifying a significant difference between the daily market value of a security and the intrinsic value of that security is what defines an investment opportunity.