To view this letter in PDF Format lease click here: 2023-Q4 PBCM Investor Letter.pdf
Welcome to our new investors and thank you to our existing clients and partners for their continued support. We are pleased to present our results for the fourth quarter of 2023 in the following pages.
After reading this letter, please do not hesitate to contact us if you have any questions, want to discuss any topics in greater detail, or would like to learn more about our Concentrated Value portfolio. We can be easily reached via e-mail at info@pelicanbaycap.com. We welcome your feedback and look forward to your correspondence. Additionally, we encourage you to share this letter with your friends and colleagues.
As we embark on a new year, it is normal human behavior to reflect on the last twelve months and imagine the possibilities for the coming year. Market strategists and pundits publish their annual forecast and predictions. How much will the S&P go up this year? How many times will the Federal Reserve cut interest rates? Will the US dollar go up or down? What about oil?
If the last three years has taught as anything, it’s that the consensus found in these outlooks is generally wrong.
For example, at the end of 2021, analysts expected the euphoric bull market to rage well into the new year. As we all know, “Mr. Market” had other ideas. Instead, 2022 saw a steep drop in both stocks and bonds, as investors were caught off guard by the Fed’s aggressive interest rate campaign to subdue inflation.
Conversely, at the start of last year, market pundits were calling for declines in asset prices in anticipation of higher interest rates and an expected recession. In fact, several popular strategists from major investment banks thought that stocks might fall for a second consecutive year. Instead, the stock market boomed and almost reached new all-time highs. If anyone thought the S&P 500 would rally 26% in 2023, they certainly didn’t have the courage to publicly admit it.
The lesson for investors is that the future is unknowable and unpredictable. Stock prices are volatile by their nature as they reflect not only fundamentals, but also human emotions and psychology. The only certainty is that markets will continue to be volatile.
We will all be better off if we ignore these annual outlooks. Instead, investors should focus on individual company fundamentals and require attractive valuations that incorporate a healthy margin of safety.
This is precisely how we manage capital in the Concentrated Value strategy. We focus our efforts on identifying high quality companies with defensible business models, healthy balance sheets, and shareholder friendly management teams. After our analysis of the company is complete, we establish an estimated range of intrinsic value. We then only invest if we can buy the stock at a wide discount to the lower end of our valuation range.
We believe if we can construct a portfolio of companies with superior qualitative attributes and cheaper valuations relative to our benchmark index, we will give ourselves the best opportunity to deliver positive alpha relative to the index. This is because we believe fundamentals matter in the long run, and higher quality businesses should ultimately be awarded a premium valuation relative to the average stock that comprises our benchmark. The narrowing of the discount between our stocks and the benchmark represents our investment opportunity and increases the likelihood of delivering attractive returns over the medium and long term.
We capture these metrics in the table below where we measure key indicators of quality companies such operating margins, returns on invested capital, and the net debt to EBITDA ratio.
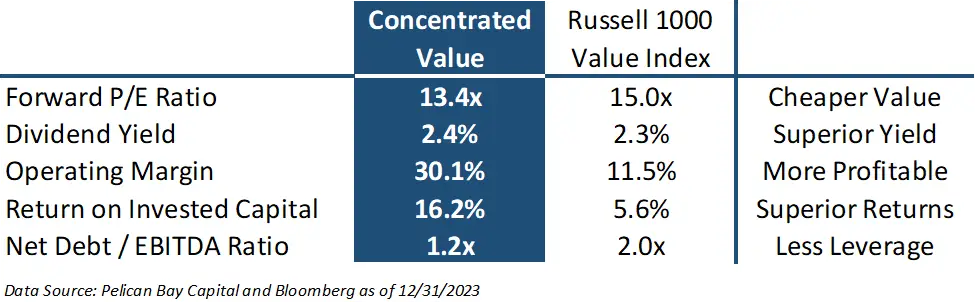
As the table above demonstrates, the companies in the Concentrated Value portfolio compare favorably on each of these characteristics. Our companies have higher profit margins, higher returns on invested capital, higher dividend yields, and less financial leverage. Yet they trade for an average price-to-earnings (PE) multiple of just 13.4x forward earnings, less than the 15.0x forward multiple of the Russell 1000 Value Index.
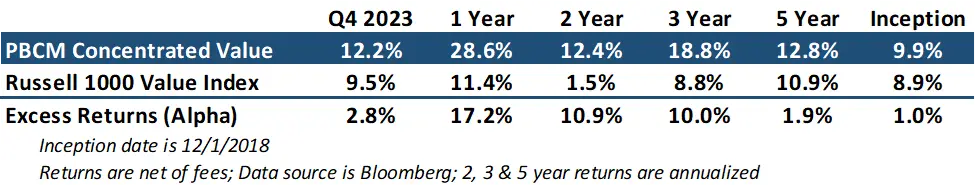
Over the last five years, the Concentrated Value portfolio has delivered solid relative and absolute returns. Of course, past performance is never indicative of future results. But we believe that our investment philosophy of buying high-quality stocks with better profitability, less-levered balance sheets, and cheaper valuations than the benchmark has given us the opportunity to deliver excess returns.
For the fourth quarter and full year 2023, the Concentrate Value strategy returned 12.2% and 28.6% respectively. The portfolio outperformed the Russell 1000 Value Index by 277 basis points in the third quarter. More impressively, for the full year we outperformed the benchmark by 1,719 basis points (or 17.19%).
The strong results in the fourth quarter were broad-based as eleven out of the twenty companies in our portfolio posted double digit returns. Equities in general rebounded sharply in November and December as the Federal Reserve indicated they were satisfied that inflation was falling and may soon cut interest rates. This resulted in a steep drop in interest rates, a loosening of financial conditions, and a return of “animal spirits”. The yield on the 10-year treasury bond fell from a peak of 5.0% to as low as 3.8%, a remarkable drop for a two-month time period.
Unsurprisingly, with the drop in rates, our homebuilding-related stocks were some of our top performers in the quarter with Toll Brothers (TOL) up 39% and Builders FirstSource (BLDR) rising 32%. Our returns in BLDR were enhanced by timely tactical position sizing adjustments as the stock swung between the top and bottom of our estimated valuation range. After trimming or holdings of BLDR in the summer at around $143 per share, we had an opportunity in October to add back to our position at a price of $117 per share. This moved BLDR back to one of our top portfolio holdings just before shares rebounded to a new all-time high of $170 by December.
Expedia (EXPE) was our best performer in the quarter. Their share price rose after the company posted strong quarterly results and raised future guidance. EXPE is benefiting from a business restructuring plan that consolidated their many online travel websites onto a single technology platform that has resulted in large cost savings and higher operating margins. We discussed the benefits of their restructuring transition at length in our Q2 2023 Investor Letter
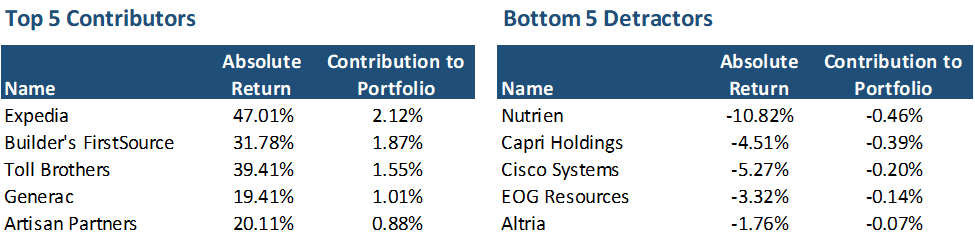
The largest detractor to performance this quarter was Nutrien (NTR). We had owned shares of NTR for several years and we had benefited from strong fertilizer prices following Russia’s invasion of Ukraine.
The spike in prices for fertilizers resulted in farmers skipping their annual applications of potash in the 2022 fall planting season. This decrease in usage was expected as it was widely believed that Farmers could skip their annual potash fertilizer application for one year with only suffering a marginal impact on crop yields. However, farmers were supposed to need to reapply potash in the second year, otherwise crop yields would drop meaningfully. This conventional wisdom that farmers couldn’t skip more than one year resulted in elevated potash prices over time.
But as the Fall 2023 planting season arrived, we noticed that farmers were deferring potash fertilizer for a second year. As this new information defied our understanding of the fundamentals of the potash market, we made the decision to exit our position in NTR as we no longer had confidence in our estimated potash price, and ultimately the company’s valuation range. Overall, we experienced a minor gain in NTR and regret not selling more than we did in 2022 as prices spiked following the Russian Invasion.
We rolled the proceeds of NTR into a new position in On Semiconductor (ON). On Semi is a specialty semiconductor manufacturer with leading positions in power management and image sensing chips. Over the last 5 years, the company has benefited from strong tailwinds in their end markets that have resulted in revenue growth of 50% and earnings growth of 130% over that time frame. We expect these tail winds to persist for many years. The company has operating margins of 30%, returns on invested capital of 20%, and little leverage on their balance sheet.
On Semi’s business can be broken up into 3 operating segments. Their primary product is power-optimizing semiconductors built on Silicon Carbide (SiC). These chips are used to regulate power between batteries and computer systems, and are critical to electric vehicles, EV chargers, solar inverters, battery storage, and other industrial applications. Demand for these chips is expected to grow between 25-30% CAGR through the end of the decade.
On Semi is the second largest producer of SiC power chips with a 9% market share. They have long-term contracts worth $11 billion with most of the major auto companies including Tesla, VW, Hyundai, and BMW. The company has been able to create a superior competitive position in the market through wholly owned low-cost SiC fabs and advanced packaging for their chips that many customers favor over rival configurations.
On Semi is building more SiC capacity through brownfield development at their legacy fabs. These older fabs can be updated for only 60% of the cost of constructing a newer greenfield fab from scratch. Additionally, these fabs are being retrofitted with state-of-the-art 300mm wafer equipment that will lower marginal costs relative to their peers. We believe this new SiC capacity provided by these brownfield projects should allow ON Semi to boost gross margins by 3% and sustain their low-cost advantage in the marketplace.
The second largest product family at On Semi is their image sensor chips that are utilized in automotive and industrial applications. On Semi is the global leader in this category with a 46% market share of the auto market, and 68% share of the autonomous driving (ADAS) segment. The image sensor market is expected to grow 12-15% through 2027.
Lastly, On Semi has another segment that provides legacy power components used in 5G communications equipment and data center servers. The legacy business is expected to fall 1-2% annually through 2027. The company is managing this division as a cash cow and they are not making further investments in these product categories.
Management believes that growing end-market demand, higher operating margins, and capacity expansion should allow On Semi to grow their free cash to $3.5-$4.0 billion in 2027, up from $1.6 billion last year. The company plans to return 50% of their future free cash flow to investors through share repurchases. They currently have a $3 billion share authorization in place, representing 10% of their $30 billion market cap. The remainder of their free cash flow will go into organic projects and tuck-in acquisitions to support growth targets. For example, they will invest $2 billion in their SiC Fab capacity expansion.
The balance sheet is in great shape with net debt of $1.1 billion, representing a low net debt-to-EBITDA ratio of only 0.3x. The balance sheet is well termed out with no maturities until a $700 million note due September 2028. The company also has access to a $1.125 billion revolving line of credit that currently has no outstanding balance. There is a convertible note due 2027 that is well in the money and will likely convert to equity. We have included the anticipated dilution from this conversion in our diluted share count when calculating our valuation range.
In late October, shares of On Semi came under pressure after the company reported a slowdown in EV component orders as some of the traditional European and American automakers paused capital investment plans for new EV lines. Additionally, economic weakness in China and Europe caused EV sales to temporarily stall. We believe the selloff in On Semi’s stocks was overdone, as sales of EVs and plug-in electric vehicles will continue to take share of the automotive market in coming years.
We estimate that On Semi can grow revenues to $9-$11 billion over the next few years with operating margins of 33-40%. This would result in normal earnings power of $5.00-7.50 per share. We believe an earnings multiple of 16-19x is appropriate for the company, which would result in an intrinsic value of $80-140 per share. We initiated our position in On Semi for $68 per share.
As we discussed in last quarter’s Investor Letter, we were in the process of selling Pioneer Resources (PXD) following a no-premium buyout bid from ExxonMobil (XOM). The merger consideration was for new shares in XOM that as of October 23rd were only worth approximately $250 for each share of PXD. Interestingly, PXD’s stock was trading for $248 leaving little room for further upside. Additionally, XOM’s $250 per share offer price was at the lower end of our estimate of fair value for PXD. Given the limited upside, we have made the decision to sell PXD and roll the proceeds into a new position in EOG Resources (EOG) so we can maintain our energy exposure.
EOG should be a familiar name for our investors, as we owned it as recently of last year. We sold our EOG shares in March to take advantage of the sell-off in Alphabet (GOOG).
EOG is the largest shale producer in the Unites States, with daily production of 970,000 barrels of oil equivalent. The company owns a diversified resource base with “Tier 1” acreage in the heart of most of the prominent shale plays in the United States. Their premium holdings are a testament to the prowess of their exploration team, as EOG was often the first driller to discover and develop these shale basins. The management team of EOG is widely considered to be one of the best in the industry.
EOG’s is one of the most profitable oil companies on the planet. Last year they generated a return on invested capital of 24% despite an average oil price of $77. These high returns are primarily a result of EOG’s industry leading drilling costs, combined with the lowest land costs in the industry. EOG’s land cost advantage is because they were often one of the first oil companies to acquire drilling rights in the core of many of the shale oil basins in the US. Additionally, they haven’t done any major acquisitions of other E&P companies to grow their land holdings. Their exploration prowess and reliance on organic growth has left EOG with a pristine balance sheet with a net cash balance of approximately $600 million.
The EOG management team is very shareholder focused and has made a commitment to return more than 60% of their free cash flow to shareholders while also growing production 5-10% annually. Over the past 12 months, EOG has paid out $5.80 per share in dividends, representing a 4.6% yield. We believe EOG can generate free cash flow of $5.5-$9.0 billion at oil prices of $80-100 per barrel. This compares attractively with their market capitalization of only $66 billion. Additionally, using the same oil price range, we believe normal earnings power is approximately $12-$14 per share. We estimate the intrinsic valuation range of EOG is $120-$190 per share. We rolled our proceeds of PXD into our new position in EOG at $126 per share, on the low end of our estimated valuation range.
Lastly, we wanted to revisit the Investment Philosophy of the Concentrated Value portfolio. We utilize a value investment strategy that seeks out companies for investment which the Portfolio Manager deems to be high quality companies. Quality is defined by possessing business operations with durable competitive advantages, allowing for high returns and growing cash flows streams. We want these high-quality companies to also have solid balance sheets, preferably with a net cash position. We also prefer that their management teams make decisions with an emphasis on maximizing shareholder returns.
Once we find these high-quality companies, we generally only invest in their stock if they trade at a steep discount to our estimate of their intrinsic value. This is necessary to provide our investors with the opportunity to generate an above market return and protect capital. This discipline creates a wide margin of safety if an undesirable scenario plays out in the future. Pelican Bay Capital Management believes that identifying a significant difference between the daily market value of a security and the intrinsic value of that security is what defines an investment opportunity.