To view this letter in PDF Format lease click here: 2023-Q1 PBCM Investor Letter.pdf
Welcome to our new investors and thank you to our existing clients and partners for their continued support. We are pleased to present our results for the first quarter of 2023 in the following pages.
After reading this letter, please do not hesitate to contact us if you have any questions, want to discuss any topics in greater detail, or would like to learn more about our Concentrated Value portfolio. We can be easily reached by phone at 239-738-0384 or via e-mail at info@pelicanbaycap.com. We welcome your feedback and look forward to your correspondence. Additionally, we encourage you to share this letter with your friends and colleagues.
One of our favorite movies of all time is the Sixth Sense starring Bruce Willis. The movie is a dark thriller with Oscar caliber performances, featuring a truly original story told by a very young and talented director, M. Night Shyamalan. The story follows a Child Psychologist (played by Willis) as he helps a young boy who believes he can see and communicate with ghosts. Without spoiling the ending, the movie concludes with one of the all-time best “I did not see that coming” surprises in film history that cemented the film into pop culture lore.
Similarly, when we reflect on the events that drove financial markets in the first quarter, there were several “I did not see that coming” moments that caught investors by surprise. For those who had Banking Panic and the FANG+ Index up 39% on your Q1 bingo cards…congratulations you win. While we were expecting market turbulence – a common feature of secular bear markets – the first quarter had many unanticipated twists and turns that few investors expected.
The new year started out with a bang. Speculative growth stocks sprinted out of the starting gate. We rely on certain indicators, such as the ARK Innovation ETF, Bloomberg Galaxy Crypto Index, and the UBS Profitless Tech Index, to evaluate the extent of investor speculation and excitement. From January 1st through February 2nd each of these indices were up 42%, 49%, and 35% respectively. Conversely, the “value trade” came to a sudden halt as the new year began, causing the high-quality stocks with reliable dividends that performed well in 2022 to fall behind. For the first quarter, the Russell 1000 Value Index was flat with a meager 1.0% gain.
We are unable to identify any reason or basis that could explain the surge in low-quality speculative stocks. This episode was reminiscent of the animal spirits during the meme stock craze in early 2021. There clearly remains an elevated level of investor speculation in the stock market. It is an indication to us that investors haven’t reached the point of total capitulation that is typically associated with the end of bear markets.
Then in March, seemingly out of nowhere came an old-school banking panic. In a four day span the second and third largest bank failures in the history of the United States occurred back-to-back. Frightened depositors pulled hundreds of billions of dollars of cash from mid and small sized banks in the click of a mouse. The speed at which these large banks collapsed was remarkable. To put it in perspective, on Tuesday March 7th, the CEO of Silicon Valley Bank was fielding light-hearted questions about his Peloton Instructor preferences at an investor conference. By Friday March 10th, the bank was in federal receivership. We are not aware of a single bank analyst or expert who saw this panic coming.
Despite the continued levels of heightened market volatility, most asset classes and stock indices were largely unchanged at the end of the quarter. The glaring exception was the mega-cap tech stocks that comprise the FANG+ Index. The constituents of the FANG+ index include Facebook/Meta, Apple, Amazon, Netflix, Google/Alphabet, Microsoft, Nvidia and Tesla.
The mega-cap tech stocks initially soared early in January on hopes the Federal Reserve was poised to pull off a “soft landing” and was nearing the end of their campaign to raise interest rates. The FANG+ stocks then continued to rise through the banking crisis as we believe many investors viewed these securities as safe havens. This view is likely a result of the strong performance of these stocks during the pandemic crisis in 2020. As the saying goes, “generals often fight the last war”. In the flight to safety, Investors flocked to Utilities, Staples, and the FANG+ stocks, because that worked in 2020.
Because of their large weight in the index, these eight FANG+ stocks accounted for the entirety of the gains realized in the S&P 500 index for the first quarter. Excluding these FANG+ names, an Index of the remaining 492 stocks in the S&P 500 would have been negative for the period. This type of narrow leadership makes it very difficult for stock pickers to beat the S&P 500 Index.
Additionally, because most of these FANG+ stocks have very high valuation multiples, their large weight in the composite also contributed to an elevated P/E ratio for the S&P 500 Index as a whole. The current P/E ratio for the S&P 500 is 18.6x based on analyst estimated earnings of $219 for 2023. This valuation multiple represents an earnings yield of 5.4%. In our opinion, the current P/E ratio combined with flat earnings estimates for this year suggest that market participants are pricing in a soft landing/no recession scenario into equity prices.
(Incidentally; rising labor costs, increasing interest rates and a significant tightening of financial conditions and lending standards suggest profit margins are likely coming down. As a reminder profit margins of 12.7% in Q4 are still well above long-term averages that historically mean revert.)
While stocks appear to be pricing in a favorable future outcome, valuations of other assets classes are pricing in more dire outcomes. For example, the bond market appears to be pricing in a moderate recession as the yield curve remains inverted and expectations are for future interest rates to fall. The commodity outlook is even more concerning as commodities such as crude oil, copper, iron ore, and gold are pricing in a deeper recession. Some investor groups may be wrong in their assumptions. Only time will tell, but historically it is the stock market that proves too optimistic.
There is also a significant divergence between the Federal Reserve’s forecasts for steady interest rates and the bond market’s expectations for future cuts in the Federal Funds Rate. Through their “dot plot” released at the last meeting of the Federal Reserve, Members of the Open Market Committee are forecasting that the Federal Funds Rate will remain flat through the end of the year. This outlook would leave the Federal Funds Rate at approximately 5% come January 2024.
Alternatively, the bond market appears to be pricing in a steep drop in the Federal Funds Rate. As of this writing, the futures contracts for the Federal Funds Rate are betting that the Fed will cut rates to 3.8% by next January. This is a wide divergence from the Fed’s 5% estimate. Once again, one of these forecasts is wrong and the embedded assumptions in these forecasts portend widely different outcomes in economic conditions for the remainder of the year.
Most importantly, when considering either scenario for future interest rates, equity investors should be concerned about both outcomes. If the Fed is right, and they hold the Federal Funds Rate flat at 5%, it is because inflation has persisted at a 4 to 6% level. Well above the Fed’s 2% target. The current multiple on the S&P 500 does not incorporate sustained levels of elevated inflation. In fact, we estimate the S&P is pricing in a return to 2% inflation in the very near future. If inflation proves sticky at current levels, then the valuation multiple on stocks would likely get re-rated to a lower level as investors demand a higher earnings yield to realize a positive inflation-adjusted return. If inflation stays elevated, the P/E multiple for the S&P 500 could fall to 12-15x, a material decrease from today’s 18.6x measure.
Alternatively, if the bond market is right and the Fed starts aggressively cutting rates this year, investors need to ask themselves what would prompt such a reversal from the Federal Reserve? In our view, the reason the Fed would be forced to pivot from their outlook and cut rates aggressively would be the result of a moderate or deep recession. A deterioration in economic activity would have negative implications for earnings expectations. It seems to us that regardless of who is right, the Fed or the bond market, stock prices in general as measured by the S&P 500 index are likely still too high.
As investors, the main inquiry we have is how our evaluation of the investment environment and current developments influence our perspective on the market in the short run. The short answer is we continue to expect elevated levels of asset price volatility and we would expect expensive growth stocks to perform poorly as the bear market in stocks continues.
We continue to see opportunities in low valuation-high dividend paying value stocks, as well as bonds and commodities. We don’t believe investors are being compensated for blindly owning the S&P 500. For the first time since the mid-2000’s period, investors can achieve 4-5% returns in the safety of risk-free money market funds and T-bills. With the S&P 500 trading at an 18.6x P/E multiple, the 5.4% earnings yield offered by stocks provides a very narrow premium to compensate investors for assuming the added risk of owning equities. Clearly, the era of there-are-no-Alternatives (TINA) is over, and investors should consider diversifying their portfolios.
We believe the best approach to equities is constructing a portfolio that favors high quality companies with high returns on capital and moderate-to-low leverage. These stocks should have attractive valuations and dividend yields that will support the share price should valuation multiples in general come under pressure. We believe the Concentrated Value portfolio meets these conditions as they align with our Investment Philosophy that we use for selecting stocks in this portfolio. In the table below we compare the key characteristics of the Concentrated Value portfolio to our benchmark.
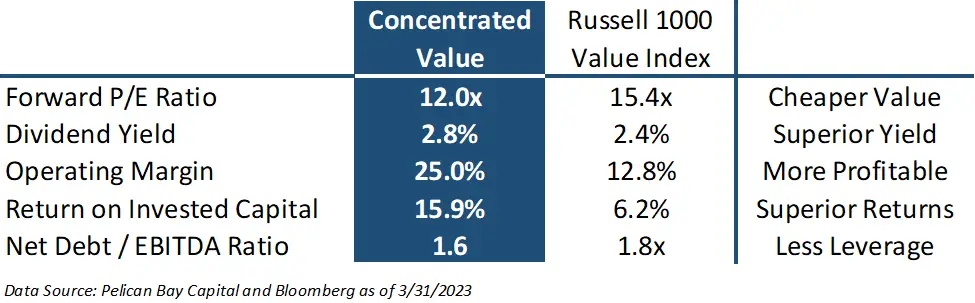
As you can see, when compared to the Russell 1000 Value Index the Concentrated Value portfolio has cheaper companies with higher profit margins and returns on capital and less leverage. We believe that constructing a portfolio with these superior attributes should give us a better chance to deliver satisfactory returns in the medium and long term.
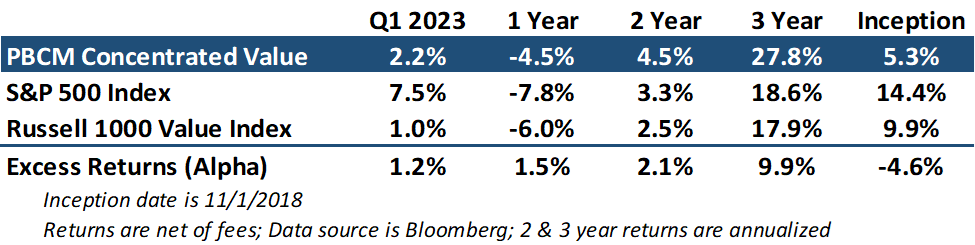
During the first quarter, the Concentrated Value portfolio outperformed our benchmark – the Russell 1000 Value Index – by 123 basis points in the first quarter of 2023. However, we did trail the S&P 500 Index which benefited from the strong gains in the mega-cap tech FANG+ stocks that we described above. Over the one, two, and three year periods the Concentrated Value portfolio has outpaced the Russell 1000 Value Index and S&P 500.
The Concentrated Value portfolio benefited from strength in the Consumer Discretionary, Healthcare, and Industrial sectors. Energy stocks that have been consistent sources of outperformance for the past two years, detracted from our performance in the first quarter. Below is a table with our top five and bottom five contributors to our return for the fourth quarter.
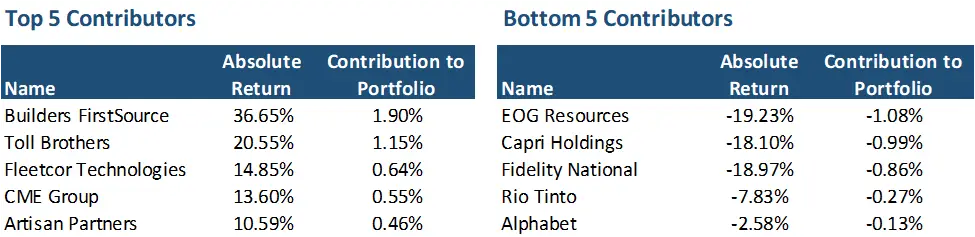
Our biggest winners this quarter were home builders and related stocks. This may be counterintuitive given the rapid rise in interest rates last year that slowed housing demand. However, these stocks were priced for very dire outcomes as they were trading for mid-single digit P/E ratios. Both Builders FirstSource (BLDR) and Toll Brothers (TOL) are generating substantial free cash flows as they work through their backlogs from the post-pandemic housing boom. They have deployed these windfalls into share repurchases that have supported their stock prices. Notwithstanding the strong gains in the first quarter, BLDR is still one of our favorite stocks at the moment and remains our largest position in the portfolio. Please see last quarter’s Investor Letter (Q4 2022) for our investment case on BLDR.
Looking at our detractors for the fourth quarter, our worst performer was EOG resources (EOG). The company had been one of our best performing stocks last year and declined in concert with other energy companies in the first quarter as oil and gas prices declined on macroeconomic fears. We ultimately made the decision to sell EOG as we felt the portfolio had too much energy exposure. We have trimmed the weight of our energy sector down to approximately 11%. The portfolio still holds large positions in Diamondback Energy (FANG) and Phillips 66 (PSX).
Our other detractors during the first quarter included Capri Holdings (CPRI) and Fidelity National Information Services (FIS). Both companies experienced large declines in their share prices after reporting disappointing financial results and weaker than expected business outlooks during their earnings calls. These two stocks alone accounted for a -1.85% headwind in our quarterly performance. We continue to believe our investment cases for both CPRI and FIS remain intact, and we added to both holdings following their post-earnings sell-offs. We estimate that both companies trade at nearly 50% discounts to our assessment of their intrinsic value ranges.
We were very active in the portfolio this quarter. Our turnover this quarter was much higher than usual as we increased the portfolio from 18 to 20 names as we took advantage of the volatile markets. In addition to selling EOG, we also exited our positions in ARKO Corp (ARKO) and Rio Tinto (RIO) in favor of better investment opportunities. We still believe both companies offer decent potential returns for investors. However, as portfolio managers we are constrained by our 20-stock limit that is mandated by our investment policy. We do believe the companies we identified to replace ARKO and RIO are superior investment opportunities and represent more diversified businesses relative to the remaining portfolio.
During the first quarter we initiated new positions in CBOE Global Markets, CVS Health, Cisco Systems, and Alphabet. You can find our investment cases for each company below. As a reminder, we did initiate a new position in Generac (GNRC) very early in January, and we discussed the investment case at length in our last quarterly letter.
CBOE Global Markets (CBOE) is a major exchange operator that is headquartered in Chicago. CBOE’s primary business is running the dominant option exchange in the US. The CBOE exchange is the leading trading venue for index options such as the S&P 500 and equity options. They collect a fee per option contract (estimated to be $0.88 per contract) and have benefited from persistently increasing trading volumes as options become more popular for retail and institutional investors. CBOE has the exclusive rights to offer futures and options products linked to the S&P 500 and VIX Indices. This business has monopoly-like benefits including pricing power. The U.S. options business accounts for roughly half of the company’s revenues. They also generate revenues from exchanges in Europe and Asia as well as fees association with selling trading data and clearing execution services.
We believe there has been a secular change in investor adoption of options in their investment strategies. In the last 6 months there has been an explosion of daily volumes for one-day-to-expiry options (ODTE). Historically, CBOE offered options that expired every month, and then every week. In the fourth quarter of last year they introduced options that expired every day of the week. ODTE options have become a popular tool for investors to implement hedging strategies or speculators such as day traders looking to supersize potential gains. Trading in ODTE options now accounts for roughly half of daily trading activity for all options in the United States.
The popularity of ODTE options will be a significant driver of profitability for CBOE that we don’t believe is reflected in CBOE’s current share price. ODTE options are extraordinarily more lucrative for CBOE compared to monthly or weekly options. For example, as investors transition from monthly to ODTE options, then the number of contracts purchased per month would increase from a single contract to twenty contracts. Similarly, if an investor had been using weekly contracts they would increase their purchases from four contracts per month to 20 contracts, a four-fold increase. As CBOE charges a flat fee per contract, the adoption of ODTE option represents a significant boost to their revenues.
Beyond the US Options market, CBOE’s business is split into U.S. stock exchanges that compete with NYSE and Nasdaq, as well as multiple international stock exchanges and clearing houses across spread across Europe and the Asian Pacific region. These business units are highly competitive and come with much lower operating margins than the US Options Unit.
CBOE has been investing heavily in recent years to grow their international operations. Their platform across all 26 exchanges is built on common technology which allows for lower operating costs and seamless interoperability for global customers. They believe a common platform is more attractive to their clients and should help CBOE capture market share from competitors.
In fact, spending associated with growing the international exchange business gave us an opportunity to accumulate our position in CBOE. Increased spending has temporarily lowered estimates for profit margins in 2023. We believe this is short-sighted as these investments should increase future revenues and profitability, and margins should recover to prior levels.
Due to the combination of increasing adoption of options by retail investors and institutional investor preference for ODTE options, we believe CBOE can grow their top line 6-10% over the next several years, and their EPS in the low double digits. Operating margins should recover to the 48-55% range in 2024 and beyond as the company ratches down the incremental organic growth spending they have budgeted for 2023. We believe after these investments CBOE should be able to generate normal earnings power of $7.00 to $8.50 per share.
The stock has historically traded for a P/E ratio of more than 25x forward earnings estimates. We believe the market rewarded CBOE with this premium valuation because of their double-digit growth potential and monopoly-like characteristics associated with the exclusive rights to offer S&P 500 and VIX option products. However, we believe a multiple of 19-22x is more appropriate for CBOE. This would result in an intrinsic valuation range of $133-187. We started building our position in CBOE at $130 a share.
We recognize our entry point is just below the low end of our estimated fair value range. We admit that our investment process normally demands a much wider discount to the low end of our intrinsic value range estimates. However, we believe an exception is justified in the rare instance where we believe the company possesses a business model with monopoly-like characteristics with a wide competitive moat and the potential to compound intrinsic value with minimal capital requirements. In the case of these exceptional companies, we will make investments at the low end of the value range as these stocks rarely trade at wider discounts. Recent examples of our investments in companies that meet this high hurdle include Amazon, Moody’s, and Republic Services.
We have reestablished a new position in CVS Corp (CVS). This is a prior holding of ours that we sold last February at $105 per share. We had made the decision to exit CVS as the stock was then trading at the high end of our valuation range. We were also concerned that the pharmacy revenues were temporarily inflated from Covid vaccination and testing services. In retrospect our timing on the sale proved prescient as the stock peaked at around $109 and has subsequently fallen back to $74.
CVS is one of the leading healthcare delivery companies in the US. They own the largest retail pharmacy and are also the number one pharmacy benefit manager (PBM). They also offer health insurance through their Aetna subsidiary and have recently made the move into the primary care business with the acquisition of Oak Street Health. We believe the integrated healthcare service model that CVS has built is unmatched in the industry and should position the company to be a leader in healthcare under most scenarios we can imagine.
We believe the normal earnings power of CVS is $8.50-$10.00 per share. We acknowledge that earnings growth will temporarily slow through 2024 as the retail pharmacy continues to normalize from its covid boost, management successfully integrates the Oak Street Health acquisition, and the company accelerates the rollout of primary care facilities nationwide. However, we expect CVS earnings growth will return to upper single digits by 2025. Debt will also be elevated in the near term because of the acquisition. Management has committed to reducing their net-debt/EBITDA leverage ratio back down to 2.0x, and they should also reach this target in 2024.
We believe the selloff in the stock price is a result of investor concerns over the temporary pause in earnings growth in 2023. We continue to believe that CVS is an excellent business with a leading position in the healthcare industry and that 13-15x earnings is an appropriate multiple for the company. Applying these multiples to our estimate of normal earnings power results in a fair value range of $110-$150 per share. We initiated our position at $74, allowing for a wide margin of safety to our estimate of intrinsic value. We will also benefit from a 3.1% dividend yield as we wait for the stock to close the gap to intrinsic value.
Late in March we initiated a new position in Alphabet (GOOG). This is the first time we have owned the company in the Concentrated Value portfolio. Alphabet is an exceptional company whose primary search business has extraordinarily high margins and a wide moat relative to their competition. The business is essentially a monopoly in digital search advertising and has the rare “pull” model that benefits from a higher customer purchase intent that marketers crave.
Importantly, Google’s search advertising model isn’t affected by recent privacy initiatives like Apple’s “opt-in” policy that requires app developers gain permission to track users’ online activity and offer targeted advertising. This policy change has severely degraded “push” or targeting advertising models.
Alphabet also owns YouTube and is the third largest cloud-computing operator. The YouTube business continues to gain active users, grow their share of consumer screen time, and attract greater share of advertising dollars. The Google Cloud business is now a well-entrenched third player that is taking share vs Amazon and Microsoft.
Alphabet has a pristine balance sheet with $83.7 billion in net cash ($6.50 per share). The business throws off tons of cash. Free cash flow was $60 billion last year and should grow to $70-$80 billion over the next two years. Alphabet has historically directed the free cash flow towards share repurchases as the company does not pay a dividend.
We believe normal earnings power at Alphabet is between $5.00 and $7.50 per share. We think our estimates could prove to be too conservative as Alphabet has recently signaled that they are going to be more disciplined on operating expenses and R&D spending. The company also has a reputation for profligate spending on “moonshot” projects and spends approximately $40 billion on R&D annually. We believe roughly half this spending is for projects with little hope of generating any financial returns for Alphabet in the near future. A more disciplined management team may be poised to cut this waste as they have recently been signaling to investors that they are prepared to adopt a cost efficiency mindset that appears to be gaining favor across the tech industry. Should management trim R&D spending, it could increase our estimate of normal earnings power by as much as $1.50 per share.
Alphabet shares have come under pressure over the last year in concert with tech stocks in general. Investors are concerned about a slowdown in the search advertising business due to the slowing economy in 2023. Shares had fallen almost 30% since their high in late 2021. We believe the company is worth $100-$165 per share and we began accumulating shares around $105. Like our entry point at CBOE, we have initiated our position in Alphabet at the low end of our fair value. This is another instance where we believe it is appropriate to pay up for a high-quality company with a fantastic business model.
Finally, we added Cisco Systems (CSCO) to the portfolio. Cisco has been on our watch list for a long time. The company meets all our investment criteria. Cisco is the dominant supplier of network equipment and software that consistently generated 25% profit margins that should increase further as software becomes a greater portion of their business mix. They have an excellent balance sheet with $12 billion in net cash ($3.00 per share). The stock has a 3.0% dividend yield and trades for 12.5x forward earnings estimates. This is well below the historical average of 14.5x and the 15-17x multiple we feel is more appropriate for this business.
Cisco is benefiting from a strong backlog heading into 2023 as global spending on network equipment continues to accelerate and many orders placed in 2022 had been delayed by supply chain issues are ready to be fulfilled. The company has guided to 10% revenue growth in 2023.
Prior to Q4 earnings some investors were concerned this backlog could be at risk from lower IT spend in general due to a weakening economic environment. However, most of the declines in IT spend were in computers and chips, not networking equipment. Demand for computers and related hardware had exploded during the pandemic as work from home initiatives lead to a burst in demand for computers, monitors, phones, and tablets. Networking equipment did not see the same increase in demand from the pandemic. As a result, in 2023 and 2024 we expect networking spend to remain more resilient than other IT segments.
None the less, we believe shares of Cisco had been discounting a slowdown in the networking equipment market. These worries created the opportunity for us to initiate a position in Cisco. Of course, a moderate recession will curtail all IT spending including networking. However, we believe networking spend will remain more robust than other areas of the IT hardware market.
Additionally, for the last several years, investors have also been concerned that as network workloads moved into public clouds that software could be the dominant factor in choosing future networking solutions. The risk is that networking hardware could become commoditized and Cisco’s pricing power could erode. However, the company has managed to develop the leading software package that has allowed them to retain their dominant position and pricing power in network equipment. Software now represents 31% of their revenues and most of this software has a recuring subscription revenue model. As the revenues mix attributable to software increases, Cisco should be awarded the higher valuation multiples associated with recurring-revenue software businesses. Increasing software sales also reduces Cisco’s exposure hardware sales that are economically sensitive and more cyclical in nature.
Looking to the medium term, we believe Cisco has normal earnings power of $3.50-4.50 per share. If we apply a 15-17x multiple and add back the $3 in net cash then our estimate of intrinsic value is $56-80 per share. We began building our position at $49 per share leaving a decent margin of safety for a high-quality company like Cisco.
Lastly, we wanted to revisit the Investment Philosophy of the Concentrated Value portfolio. We utilize a value investment strategy that seeks out companies for investment which the Portfolio Manager deems to be high quality companies. Quality is defined by possessing business operations with durable competitive advantages, allowing for high returns and growing cash flows streams. We want these high-quality companies to also have solid balance sheets, preferably with a net cash position. We also prefer that their management teams make decisions with an emphasis on maximizing shareholder returns.
Once we find these high-quality companies, we generally only invest in their stock if they trade at a steep discount to our estimate of their intrinsic value. This is necessary to provide our investors with the opportunity to generate an above market return and protect capital. This discipline creates a wide margin of safety if an undesirable scenario plays out in the future. Pelican Bay Capital Management believes that identifying a significant difference between the daily market value of a security and the intrinsic value of that security is what defines an investment opportunity.