To view this letter in PDF Format lease click here: 2022-Q3 PBCM Investor Letter.pdf
Welcome to our new investors and thank you to our existing clients and partners for their continued support. We are pleased to present our results for the third quarter of 2022 in the following pages.
After reading this letter, please do not hesitate to contact us if you have any questions, want to discuss any topics in greater detail, or would like to learn how to invest in the Concentrated Value Fund. We can be easily reached by phone at 239-738-0384 or via e-mail at info@pelicanbaycap.com. We welcome your feedback and look forward to your correspondence. Additionally, we encourage you to share this letter with as many friends and colleagues as you like.
The third quarter presented a challenging environment for investors as interest rates continued to rise and valuations declined. The bear market in equity markets continued to unfold with most major indices ending the quarter with year-to-date losses of more than 20%. We can sense a clear change in the investor narrative as the “buy-the-dip” mentality that was pervasive for the last 12 years is quickly fading with each successive bear market rally.
There appears to be a contentious debate amongst investors over the future level of normalized interest rates and the timing of the Federal Reserve’s pivot back to more accommodative monetary policies. In fairness, over the last three decades the Federal Reserve has reacted to any sustained decline in asset values or economic growth with emergency monetary accommodation. This reaction function has cynically been dubbed the “Powell Put” after Fed Chairmen Jay Powell. These investors believe the Fed is poised to drop rates back to zero in the next few quarters resulting in a bounce in asset prices.
Conversely, other investors believe that inflation will persist, and the Federal Reserve will not be able to engage in further policy accommodation without stoking even higher inflation. Interest rates would therefore stay higher than the last decade as Fed policy remains restrictive for a sustained period to control inflation. This outcome would likely result in lower asset prices as investors are forced to adjust to a new higher interest rate regime. At Pelican Bay Capital Management, we tend to put more weight on the latter argument.
In our view, a wholesale reassessment of asset valuations should not come as a surprise and in fact is a very healthy and necessary step towards normalization. Asset prices were unsustainably high coming into 2022. It is important to remember how markets got to this point to begin with.
On the eve of the Covid Pandemic, investors had enjoyed eleven years of unprecedented monetary accommodation. Central banks turned emergency quantitative easing programs that were meant to be a temporary fix to the global financial crisis into standard operating procedure. The European and Japanese central banks embarked on a negative interest rate experiment that at its peak in 2018 resulted in approximately 40% of bonds globally having negative yields. The acronym “TINA” was born (“there is no alternative”) and stock valuations rose to record levels last seen since during the Internet Bubble of the late 1990’s.
As Covid struck, policy makers responded with even more stimulus and liquidity, making their prior efforts look paltry in comparison. Between 2020 and 2021 the Federal Reserve and US Congress delivered a combined ten trillion dollars in total stimulus, much of which found its way into the stock market. As we had detailed in our quarterly letters from 2021, there was plenty of evidence of speculative excess and unjustifiably rich valuations that all but ensured minimal future returns or even out-right losses for many over-valued stocks and bonds.
The important question on our clients’ minds is how long this bear market will last as valuations search for a new, lower equilibrium. Of course, the short answer is no one knows. The normalization process is unpredictable and volatile. When considering a broad index of stocks or bonds, it ultimately depends on where interest rates normalize for the medium term. Do they continue to increase as inflation persists or do they return to zero? It’s simply unknowable.
If history is any guide, bear markets tend to last 9-18 months and result in drawdowns between 27-33% on average. This current bear market has already declined 24% over the past 9 months, suggesting that we could be more than halfway done.
Additionally, we can attempt to apply some fundamental analysis to the question. We can make a simple estimate of the fair value range of the S&P 500 Index and compare it to its current 3,600 level. This is done by multiplying estimates for the cumulative earnings power of the S&P 500 by an appropriate price-to-earnings (P/E) multiple.
The P/E multiple is effectively the reciprocal of the required return for equities. For example, a 10x and 20x P/E multiple represents a 10% and 5% required return on equities respectively. This required return is usually calculated as the 10-year treasury yield (4.0% today) plus an equity risk premium to compensate investors for the added risk of owning stocks.
Right now, the S&P 500 Index is at 3,600. 2022 consensus expected earnings for the S&P 500 are $224 per share. So the forward P/E multiple is 16.0x, or 6.2% required return. With the 10-year at 4.0%, this implies the market risk premium is only 2.2%. This compares to a historical range of 3-4%. Taking into consideration heightened market volatility and potential for an economic slowdown, a below average equity risk premium of only 2.2% doesn’t appear entirely adequate or appropriate.
If we apply the historical range of 3-4% equity risk premium to the current 4.0% 10-year treasury yield, then the required return for stocks would be 7-8%. This would translate into a P/E multiple of 12.5x-14.3x. Multiplied by consensus estimates of $224 per share, this would imply a fair value for the S&P 500 Index of 2,800-3,200. As of this writing, the S&P 500 currently trades for 3,600. If we dare to assume that interest rates stabilize near current levels of roughly 4% on the 10-year treasury, then there could be more pain ahead for the S&P 500 Index.
As we have demonstrated it is possible that the bear market may continue for some time. What should investors do in this turbulent market environment?
While the stock market as reflected by the S&P 500 may continue to fall, we believe there are some sectors and individual stocks that represent attractive investment opportunities (we will discuss many in detail below). In our estimation, elevated valuation multiples embedded in the S&P 500 are mostly the result of unjustifiably rich valuations of growth stocks that account for the majority of that index. Comparatively, many value stocks appeared fairly priced. This disparity has been reflected in lower drawdowns for value-oriented indices. For example, the Russell 1000 Value Index is down 17.8% year-to-date compared to a decline of 30.7% for the Russell 1000 Growth Index.
Value stocks have underperformed for a decade as declining interest rates made far-off future income streams much more valuable, and therefore growth stocks more attractive. However, should interest rates normalize at a higher rate than the last decade, it is not unreasonable to assume the value stocks could continue to recapture much of their relative underperformance to growth stocks. Higher interest rates require investors to place more consideration on current fundamentals like business profitability, balance sheet strength, and valuation.
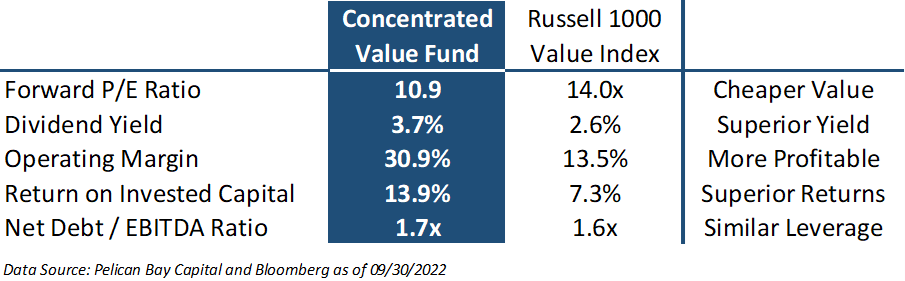
In the last several quarters, this environment has played into the strength of our Concentrated Value strategy. At the core of our investment philosophy, we seek to own high-quality companies with solid balance sheets and defensible business models that are generating significant levels of free cash flow, that at purchase are trading for a discount to estimate of their intrinsic value.
When compared to the Russell 100 Value Index, the composition of companies in the Concentrated Vale portfolio are cheaper with superior financial metrics and similar leverage.
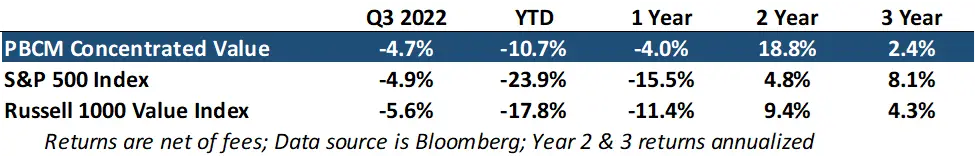
As you can see in the table of our returns on the first page, the Concentrated Value portfolio has outperformed our benchmark (Russell 1000 Value Index) by 710 basis points year-to-date and 940 basis points over the past two years. We have outperformed the broader S&P 500 Index by even wider margins as that broad index had more exposure to growth stocks.
During the third quarter of 2022, we slightly outperformed the Russell 1000 Value Index by 90 basis points. The portfolio finished the quarter down -4.7%. We continued to see strength in our Energy and Basic Materials stocks. These gains were offset by weakness in Communications and Financial companies. Below is a table with our top five and bottom five contributors to our return.

ARKO was the portfolio’s biggest winner this quarter. The company is the seventh largest operator of gas stations in the United States. ARKO benefited from falling retail gasoline prices as this resulted in higher spending in their more profitable convenience store operations. Additionally, fuel selling margins tend to temporarily expand above normal when gasoline prices fall.
The company has also benefited from an aggressive roll-up acquisition strategy of smaller, rural gas stations where ARKO can quickly improve profitability through their larger purchasing organization for fuel and food. These acquisitions often have neglected locations with inadequate convenience store operations that can be remodeled at very attractive returns on capital.
The share price has been relatively flat since our purchase in 2021 at approximately $10 per share. We estimate that the intrinsic value of ARKO is between $16-$22 per share.
Both Republic Services (RSG) and EOG Resources (EOG) continued their relative outperformance as both companies have been on the list of top contributors for two quarters in a row. They are also the portfolio’s largest two holdings as of September 30th, 2022.
Republic Services is one of the compounders in our portfolio. The company benefits from CPI linked contracts in their residential garbage pickup business which is recession resistant. Additionally, the company has strong pricing power at many of their landfills, as it is extraordinarily difficult for new competing landfills to win local regulatory approvals. RSG has grown their EPS 12% annually over the last 8 years with EBITDA margins of approximately 30%.
The largest detractor to performance in the third quarter was Verizon (VZ). We must admit we were surprised by this result as the underlying business has been incredibly stable and the valuation was already far too low in our opinion. As of this writing, shares are trading for less than 7.0x earnings, which represents a 14% earnings yield.
We must admit that this valuation makes very little sense to us. We thought Verizon shares were mispriced at 10x earnings. The company is in an oligopoly with AT&T and T-Mobile and should generate low single digit earnings growth as the number of 5G enabled devices increases. We view the business as a utility and can’t square the current valuation of 7x earnings with electric utilities that trade for 24x earnings or cable companies that only 2 months ago averaged 15-18x earnings.
At the current valuation, we believe it will be incredibly difficult to lose money on Verizon over the next three years if earnings power doesn’t deteriorate. Earnings are expected to range between $5.10 and $5.30 during this period and the annual dividend of $2.61 is well covered by free cash flows. Verizon currently trades for $36 per share. Over the next 3 years, dividend payments will likely total at least $7.80 per share. For our investors to experience a negative total return over this period, Verizon’s share price would have to fall to $28. With $5.30 in earnings power, this would represent a P/E multiple of just 5.3x. That could happen, but we believe it is highly unlikely. Additionally, to earn a total return of 10% annually over the next three years, shares would only need to appreciate to $39 from $36 today.
Another detractor to this quarter’s returns was Altice USA (ATUS). The company is a cable provider in the northeast and southwest U.S. We initiated our position in Altice in September 2021 after shares fell 20% following a poor earnings report with flat subscriber growth and the announcement of a multi-billion-dollar plan to increase CAPEX for new fiber deployment.
We initially thought declining subscriber counts were temporary due to extreme weather events in Texas, but ultimately proved to be the start of what we now believe are secular declines in broadband users. Separately, the cost of their large fiber rollout plan increased with inflation, lowering the return on this significant investment for investors. Lastly, we underestimated the strength of the balance sheet with the view that their elevated leverage was less of an issue due to recurring subscriber revenues. Consecutive quarters of falling subscriber counts and higher than forecast CAPEX costs made us revisit our initial purchase thesis and changed our analysis. That resulted in our decision to exit our position.
During the third quarter we initiated a new purchase in a company called Builders FirstSource (BLDR). We are very bullish on the outlook for the housing market over the next several years, despite the recent slowdown caused by surging mortgage rates. Following the collapse of the housing bubble in 2007, new home sales lagged demographic growth for more than a decade, resulted in a current housing deficit that is estimated to be in a range of 3-5 million single family units. The transition of millennials into peak homebuying age and the population migration away from the coasts is exacerbating this deficit and leading to increasing demand for more new homes.
We believe BLDR presents the best opportunity for investors to benefit from this trend. Compared to traditional homebuilders, BLDR has a superior market position with higher and more stable margins, a less capital-intensive business model, and a superior balance sheet. Best of all, the company is generating extraordinary levels of free cash flow that currently equates to 25% of their market cap, and they are returning most of this cash to investors.
BLDR is the 800-pound gorilla in the home building supply distribution market. With $20 billion in annual revenue, they are twice as large as their nearest competitor, who themselves are double the size of the third-place peer. BLDR has achieved this scale through an aggressive roll-up of what has traditionally been a very fragmented industry. Over the last building cycle that started with a housing collapse in 2006, BLDR has grown their revenues by 12x and their profitability by 60x.
Through their economies of scale, BLDR has been able to eliminate over 400 basis points of their cost structure relative to their competitors. This has allowed their operating margins to increase to 20% versus 16% if there were no benefits to scale. They have invested in automated framing and truss facilities that are unmatched by any peers. These prefabrication truss facilities allow BLDR to create significant pricing differentials versus the industry.
Despite their growth, the industry remains highly fragmented with 1,000 smaller competitors representing $80 billion in annual revenues. BLDR management is confident they will continue to find attractive acquisitions targets for the foreseeable future. The company is also investing organically in more automated truss-manufacturing facilities, value-added private label products, and construction software that should allow for further margin enhancements.
Over the next four years, the company has a credible plan to generate $7 billion in operating cash flow of which $2 billion will be directed towards acquisitions at approximately $500 million per year, and the remaining $5 billion can be returned to shareholders via special dividends and share purchases. To put this in perspective their current market cap is only $9 billion. In the last 12 months alone, they executed $2 billion in share repurchases that retired approximately 25% of the company’s shares outstanding.
The company also has better downside protection relative to homebuilders if the current housing market slowdown becomes prolonged. Approximately 70% of BLDR’s SG&A cost are variable. The company has the levers to pull to handle a housing downturn where new unit sales volumes fall by 20%. In fact, a housing downturn may benefit the company as they can opportunistically accelerate their mergers and acquisitions plans to take advantage of smaller distressed peers. The balance sheet is an excellent shape with net debt to EBITDA ratio of 0.9x and no material debt maturities until 2030.
From a valuation perspective, we estimate that BLDR has normal earnings power between $5 and $10 per share, with the large range driven by swings in lumber prices and housing growth rates. With their double-digit margins, clean balance sheet, and expanding competitive advantage we believe shares should trade for 15-17x normal earnings power. This would result in an intrinsic valuation range of $75-$170 per share. We initiated our purchase at $62 per share.
Lastly, we wanted to revisit the Investment Philosophy of the Concentrated Value Portfolio. We utilize a value investment strategy that seeks out companies for investment which the Portfolio Manager deems to be high quality companies. Quality is defined by possessing business operations with durable competitive advantages, allowing for high returns and growing cash flows streams. We want these high-quality companies to also have solid balance sheets, preferably with a net cash position. We also prefer that their management teams make decisions with an emphasis on maximizing shareholder returns.
Once we find these high-quality companies, we generally only invest in their stock if they trade at a steep discount to our estimate of their intrinsic value. This is necessary to provide our investors the opportunity to generate an above market return and protect capital. This discipline creates a wide margin of safety if an undesirable scenario plays out in the future. Pelican Bay Capital Management believes that identifying a significant difference between the daily market value of a security and the intrinsic value of that security is what defines an investment opportunity.