To view this letter in PDF Format lease click here: 2022-Q4 PBCM Investor Letter.pdf
Welcome to our new investors and thank you to our existing clients and partners for their continued support. We are pleased to present our results for the fourth quarter of 2022 in the following pages.
After reading this letter, please do not hesitate to contact us if you have any questions, want to discuss any topics in greater detail, or would like to learn how to invest in the Concentrated Value Fund. We can be easily reached by phone at 239-738-0384 or via e-mail at info@pelicanbaycap.com. We welcome your feedback and look forward to your correspondence. Additionally, we encourage you to share this letter with your friends and colleagues.
2022 was a challenging year for investors. Stocks succumbed to what may prove to be the opening stages of a prolonged bear market. The S&P 500 Index peaked on January 3rd, 2022 and finished the year down -18.1%. Bond markets fared much worse, with U.S. Treasuries as measured by the ICE U.S. Treasury 20+ Year Bond Index falling -31%, registering their largest drop in 100 years. Commodities were the only major asset class to finish with a positive return in 2022.
Of course, it is impossible to know with any certainty when or if a bear market will materialize. However, as we noted in our 2021 investor letters, the necessary conditions and ingredients were present for 2022 to be a challenging year. Looking back to the start of the year, stocks were at record high valuations and there were clear signs of investor euphoria on display with the zeal associated with meme stocks, profitless tech companies, and SPAC issuers. Additionally, the monetary authorities were preparing to remove liquidity from the financial system by ending their quantitative easing programs and raising interest rates.
However, just as unknowable as when markets will fall, is timing when markets will bottom. A historical review of prior bear markets suggests on average they last 18-24 months with declines in stock prices of 25-35% from peak levels. On average, in each bear market since 1949, the S&P 500 didn’t trough until the ISM Manufacturing Purchasing Managers Index (PMI) fell to 43.6, the unemployment rate increased by 1.3%, and one-year forward earnings per share (EPS) estimates declined -10.8%. Unfortunately, none of these conditions exist today as the PMI is still at 48.4, the unemployment rate is up only 0.2%, and forward earnings estimates for the S&P 500 Index are down just 3.9%.
Moreover, many of the troubling fundamentals that immediately preceded this bear market still exist. For example, we believe that stocks in general remain expensive and the federal reserve continues to raise interest rates and engage in quantitative tightening. We would not be surprised if the volatile markets we experienced last year continue into the first half of 2023 or potentially even longer.
In fact, from a fundamental perspective, we continue to see a clear disconnect between current stock valuations and interest rates. We can make this observation by using prevailing interest rates to arrive at an appropriate price-to-earnings (P/E) multiple for the S&P 500 Index and compare it to the actual reading. This is because the P/E multiple is effectively the reciprocal of the required return for equities. For example, a 10x and 20x P/E multiple represents a 10% and 5% required return on equities respectively. In practice, the required return for equities is usually calculated as the 10-year treasury yield plus an equity risk premium to compensate investors for the added risk of owning stocks.
Currently, the S&P 500 Index is at 3,900 points. According to Bloomberg, consensus estimates for 2023 earnings for the S&P 500 Index are $224 per share. Therefore, the prevailing forward P/E multiple is 17.4x (3,900 divided by $224). The reciprocal of a 17.4x multiple corresponds to a 5.75% required return for stocks. The current 10-year Treasury yield is 3.5%, which implies the equity risk premium is only 2.25% (5.75% minus 3.5%). This compares to a historical range of 3-4% for the equity risk premium.
If we apply the historical equity risk premium range of 3% to 4% to the current 3.5% 10-year Treasury yield, then the normalized range of the required return for stocks would be 6.5% to 7.5%. This would translate into a P/E multiple range of 13.3x-15.4x. Multiplying these multiples by consensus estimates of $224 per share would imply a fair value for the S&P 500 Index of 3,000-3,450. As of this writing, the S&P 500 currently trades for a considerably higher 3,900, which implies that stocks are expensive relative to prevailing interest rates.
Given the uncertainty surrounding the sustainability of inflation, the elevated probability of a recession in the next twelve months, and a ground war in Europe; a paltry 2.25% equity risk premium doesn’t seem to be appropriately rewarding investors for the risk of owning stocks in general. If we dare to assume that interest rates stabilize near current levels of roughly 3.5% on the 10-year treasury, then there could be more pain ahead for the S&P 500 Index.
In our opinion, stocks appear to be pricing in a soft landing and return to the era of low interest rates that existed for the last decade. While this is certainly a potential outcome, we believe it is a low probability.
Importantly, when we reflect on the prior decade’s bull market, monetary authorities around the globe were solely concerned (some might say obsessed) with battling deflation and its negative influence on economic growth. The central banker’s arsenal to combat deflation consisted of negative interest rates and endless “emergency” quantitative tightening.
Today, we think it is reasonable to presume that deflation isn’t even on their radar screens. Central bankers are not concerned with deflation, and they no longer have a need or willingness to deploy the monetary tools to combat it. Until, the Fed Chairman begins delivering speeches on the risk of deflation, it is unlikely that we return to the “Free Money” era that embodied the investment environment of the last 12 years.
Conversely, the current macro-economic challenges facing central bankers include persistent levels of elevated inflation, shortages of both labor and major commodities, an overhaul of global supply chains, and declining confidence amongst corporate executives. We haven’t seen a similar combination of risks since the 1970’s.
We believe the market volatility over the prior year is a result of the increasing realization amongst investors that interest rates may not be headed back to zero. It is possible that the factors that drove above-average stock returns in the prior decade could be undergoing a secular transition. These market regime transitions seem to unfold every other decade or so, and it isn’t uncommon for months or even years to transpire before it becomes obvious the landscape has shifted. It seems to us that asset valuations could remain volatile and continue to decline in that environment. The bear market in stocks may not yet have run its full course.
The silver lining of bear markets is that future long-run returns are getting better for investors, and they are certainly more attractive today than at the beginning of last year. And more importantly for us, we see incredible opportunities in beaten-up value names that offer the potential for attractive future returns. These companies have above-average levels of profitability, strong balance sheets, shareholder friendly management teams, and in our estimation, stock prices that represent a discount to our estimates of their intrinsic values. As investors we seek out companies with these characteristics, and they represent the core of our investment philosophy.
The influence of these factors is measurable and representative of our portfolio. When compared to the Russell 1000 Value Index, the composition of companies in the Concentrated Value portfolio are cheaper with superior financial metrics and marginally more leverage. The comparison can be found in the following table.
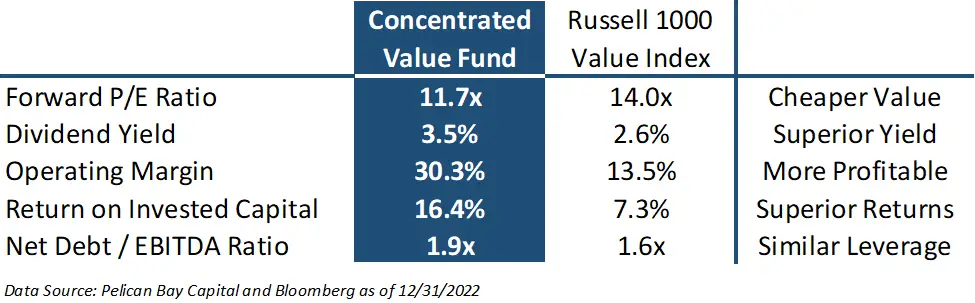
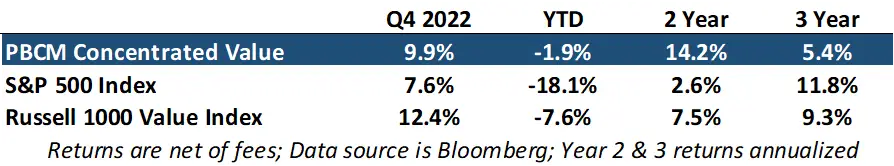
We believe that constructing a portfolio with these superior attributes should give us a better chance to deliver satisfactory returns in the medium and long terms. As you can see from the table on page one, the Concentrated Value portfolio delivered outstanding relative returns in last year’s challenging market. The portfolio outperformed our benchmark – the Russell 1000 Value Index – by 570 basis points in 2022 and 670 basis points annually over the past two years. We have outperformed the S&P 500 Index by even wider margins as that broad index had more exposure to growth stocks.
Reviewing our fourth quarter results, the Concentrated Value portfolio returned 9.9% for the period. The portfolio trailed the 12.4% gain in the Russell 1000 Value Index, which benefited from greater exposure to the healthcare, financial, and industrial sectors. These sectors of the market delivered the strongest price gains in the fourth quarter. Conversely, the portfolio outpaced the 7.6% return in the S&P 500 Index for the fourth consecutive quarter as this index has a greater exposure to growth stocks, which underperformed value stocks.
The Concentrated Value portfolio continued to benefit from strength in our energy, basic materials, and consumer discretionary stocks. Below is a table with our top five and bottom five contributors to our return for the fourth quarter.

Capri Holdings (CPRI) rebounded strongly in the fourth quarter as the company saw increasing demand for luxury goods business despite large price increases. Additionally, Capri’s revamping of their ecommerce strategy has resulted in sustained levels of higher sales. Ecommerce revenues have grown to 13-18% of total company sales versus less than 5% before the pandemic. Their stock continues to be valued at a significant discount to its luxury good peers and our estimate of its intrinsic value range. We believe significant upside remains as this valuation gap closes. A recession could present a near-term challenge, but we believe it is well discounted in the low price of the stock and would have little impact on the long-term value of the company.
Our energy positions continue to positively contribute to the portfolio. In particular, EOG Resources (EOG) sustained its place on the list of top five contributors for the third quarter in a row. Phillips 66 (PSX) was our second-best contributor in the fourth quarter as refining margins have proven to be resilient at levels significantly above long-run averages. We believe this higher level of profitability can be sustainable in the in the medium term as increased demand for finished products like gasoline and diesel fuel are outpacing refining capacity.
Looking at our detractors for the fourth quarter, the list is comprised of many companies that were strong performers in prior quarters that have given back some of their earlier gains, which is not unusual in the short term. For example, Nutrien, ARKO Corp, and Republic Services were on the list of top contributors last quarter (Q3 2022). As nothing changed fundamentally, we often use these short-term pullbacks as opportunities to add to our positions.
Shares of Fidelity National Information Systems (FIS) continue to underperform. Their third quarter results disappointed investors as the company continues to see weakness in their merchant processing business that represents approximately 30% of their sales. They entered this business with the $41 billion acquisition of World Pay in 2019, just in time for the business to be materially impacted by the pandemic. Most of their merchant processing clients were small and medium-sized businesses that were disproportionately impacted. Our expectations for a more rapid recovery in the merchant processing business have been stymied by intensifying competition from new payment technologies.
In December, pressure from activist investors D.E. Shaw and JANA Partners led to FIS initiating a comprehensive assessment of the merchant processing business that may result in the sale of this business unit. We believe this is a positive development as it could unlock shareholder value and refocus investors on their amazing software business.
The gem at FIS is their banking and capital markets software business units that represent 70% of their sales and the lion’s share of their profits. They are the industry leader in this space and their software provides mission critical operating functions for banks that results in large barriers to entry for competing firms and strong pricing power. Their contracts have multi-year terms and very high renewal rates. This business has EBITDA margins of roughly 40% and is growing mid-single digits as more facets of bank operations are digitized.
We believe the normal earnings power of FIS over the next two to three years will be between $7 and $8 per share when excluding purchase accounting amortization costs. We expect revenues to grow at high-single digits with mid-40% EBITDA margins. Leverage is elevated but manageable with $17 billion in net debt representing 2.6x turns of leverage. The company will use free cash flow to reduce this number back to 2x, while maintaining a 2.5% dividend yield. The debt is well termed out with an average coupon rate of just 2.3%.
FIS is a high-quality business with above average growth, margins, and competitive advantages. We believe shares should trade between 16-20x normal earnings power representing an intrinsic value of $110-160 per share. The stock currently trades at $74 per share.
We did not add any new positions to the portfolio during the fourth quarter. However, in early January we did build a new position in Generac (GNRC), a leading manufacturer of residential and commercial standby generators. Generac also has a growing solar and energy storage unit. These new product lines have increased the company’s addressable market opportunities as they are complimentary to the generator business and can be plugged into Generac’s existing dealership network.
The U.S. generator industry is benefiting from two secular trends that we expect to persist for the foreseeable future. First, is an emphasis to decarbonize the electrical grid that has resulted in a greater dependence on less reliable power generation capacity such as wind and solar. Second, is a rise in major outages due to an increased frequency of severe and volatile weather. The combination is resulting in growing instances of Utility Outage Hours. As personal electronics usage, electric vehicle adoption, and remote/hybrid work trends persist, there is simply a greater sensitivity to power outages and therefore a greater demand for standby power.
The penetration rate of home standby generators is very low and is currently only 5.5% of single-family homes. This is up from a penetration rate of just 2% only 10 years ago. Northeastern states have the highest penetration rates – between 12% and 20% – as snow and ice storms frequently knock out power in the region. Conversely, states like Florida, Texas, and California that have experienced frequent power outages over the last few years have penetration rates of less than 3.5%. We don’t think it is unreasonable that the penetration rate for standby home generators in the U.S. could climb to 10% by the end of the decade.
We have admired Generac for many years as they profitably capitalized on the secular growth in generator demand. Unfortunately, we never had the opportunity to own shares as they always appeared too expensive and never sold for less than our estimate of fair value.
However, in the second half of 2022, shares came under considerable pressure as Generac invested heavily in expansion capacity to meet the booming demand for standby generators. However, their dealership channel struggled to keep pace. The dealers did not have the installers or salespeople to meet Generac’s lofty growth projections. This resulted in inventory and logistical challenges that caused a 3% hit to gross margins. The company also overspent on marketing assuming the dealership and installation network could absorb these higher costs. Management had to reduce their revenue expectations for this year, which led to worries about future growth rates. Generac’s share price fell from $300 to $100.
We believe these challenges will be short term as they pause their sales & marketing plans to allow their operations and dealership networks to digest the rapid growth of the past four years. We believe revenues could be flat to down in the next year as they consolidate their operations at current levels before resuming their growth trend. After a flat 2023, sales growth could return to 10-15% levels in 2024 and beyond. We also expect operating margins to return to a range between 15-19%. This should result in normalized earnings power of $8-10 per share. With Generac’s long-term growth potential, high returns on equity, and moderate financial leverage, we believe a 16-18x multiple is appropriate for the company. This would result in a valuation range of $130-180 per share. We began accumulating shares at $106.
Lastly, we wanted to revisit the Investment Philosophy of the Concentrated Value Portfolio. We utilize a value investment strategy that seeks out companies for investment which the Portfolio Manager deems to be high quality companies. Quality is defined by possessing business operations with durable competitive advantages, allowing for high returns and growing cash flows streams. We want these high-quality companies to also have solid balance sheets, preferably with a net cash position. We also prefer that their management teams make decisions with an emphasis on maximizing shareholder returns.
Once we find these high-quality companies, we generally only invest in their stock if they trade at a steep discount to our estimate of their intrinsic value. This is necessary to provide our investors with the opportunity to generate an above market return and protect capital. This discipline creates a wide margin of safety if an undesirable scenario plays out in the future. Pelican Bay Capital Management believes that identifying a significant difference between the daily market value of a security and the intrinsic value of that security is what defines an investment opportunity.