To view this letter in PDF Format please click here: 2021-Q3 PBCM Investor Letter.pdf
Dear Investors,
We would like to begin by welcoming our new investors to our funds and thanking our existing investors for their continued support. We are pleased to report our returns for the third quarter of 2021. Our portfolios held up well in a challenging environment for active stock pickers. Low summer trading volumes, poor market breadth, and weakness in value-oriented small and mid-cap equities presented headwinds relative to the S&P 500 Index.
As we mentioned in our Q2 letter, we believed markets could “get choppy in the third quarter.” In July, weakness first manifested in value-oriented stocks and small caps. By late September, investor sentiment turned sour across the board and volatility spiked. For the month of September, the S&P 500 Index fell -4.7% led by negative returns from large-cap tech (which up to that point, had been the sole outperformer during the quarter). September represented the first month of negative monthly returns for the S&P 500 index since January, and the worst result since March 2020.
Ultimately, equities were flat to slightly down in the quarter. The S&P 500, S&P Midcap 400, and Russell 2000 produced returns of 0.6%, -1.8%, and -4.4% respectively. Despite our concentrated portfolios and high active share, our portfolios were in line with these results. The returns for each portfolio for the third quarter and year-to-date are presented in the table below.
While it is early in the fourth quarter, market volatility has remained elevated, interest rates continue to rise, and valuations remain under pressure. We believe our portfolios are well positioned for the current market environment and we are proactively managing risk levels should asset prices come under more severe stress.
New Format for Investor Letter
Moving forward, we are making changes to the layout and composition of our quarterly investor letter. We have elected to remove the Market Commentary Section that has normally been included in this letter. We will be transitioning this content to a new series of memos that will be published separately. These memos will include our general thoughts on markets and investing that in the past were included in this quarterly letter.
We believe this transition will benefit our clients and readers on several fronts. First, it will cut down on the length of the quarterly investor letters. Second, it will allow us to deliver more timely thoughts on markets and investing without being confined to our normal publication schedule at the end of the quarter. Third, we have come to recognize there is a separate audience for our information on our portfolio performance and market commentary, and this will deliver a more efficient solution for our readers.
If you would like to be included on the distribution list for our new memo format, please email us at info@pelicanbaycap.com with “Memo” in the subject line. We will also publish these memos on our website and LinkedIn page.
The layout of this quarter’s letter will focus exclusively on individual reviews and analysis of each of our portfolios including Concentrated Value, Dynamic Income Allocation, and the Phoenix Fund.
As always, if after finishing this letter you have any questions or would like to discuss any topics in greater detail, please do not hesitate to call us at 239-738-0384 or send an e-mail to tyler@pelicanbaycap.com. We welcome your feedback and look forward to your correspondence. Additionally, we encourage you to share this letter with as many friends and colleagues as you like.
Concentrated Value
Since November 1st, 2020, the Concentrated Value Portfolio has appreciated by 56%. After realizing large gains in a short period, performance was due to take a breather. In the third quarter the portfolio had a small decline of -2.36%. It was a challenging quarter as the strong performance of value stocks and “reopening” stocks began to reverse in mid-June. Most of this quarters decline occurred in July when value-oriented stocks corrected sharply.
Every dark cloud has a silver lining, and we are pleased to report that the recent market weakness has allowed us to make two new investments, add to our existing positions, and bring our cash levels below 1%. More importantly, looking through our holdings we are still excited about our portfolio as we estimate that our companies remain substantially undervalued despite the large gains in the first half of the year.
Turning to individual results, we continue to see strength in Energy and Industrial sectors as commodities delivered the strongest returns in the quarter. Our best performing company in Q3 was Arko, as their stock price rebounded following a sharp selloff in June as investors indiscriminately sold off SPAC-sponsored companies following several high-profile scandals at some of the more popular SPACs. Many other SPACs came public with unproven business models, no revenues, and in some instances, no working product.
Conversely, Arko has a real business, with real physical assets, in a century-old established industry. Arko is the 7th largest gas station operator in the US. The company is led by one of the best CEO’s in the gas station industry. He and his partners have significant personal capital on the line, and a track record of acquiring underperforming gas stations and improving operations and shareholder returns. We believe shares are worth $14-$15 today and should compound in at double digit rates as management works its capital allocation magic. If management can continue to find attractive acquisition targets, we believe the stock could fetch $20 per share in the next two or three years, providing an excellent return to shareholders.
Our second-best performer this quarter was Republic Services (RSG). We admit that we have been negligent for not writing about RSG in our previous letters to date. RSG is an amazing company that seemingly compounds at a methodical rate each quarter. The pullback in the stock prices at our other companies has finally shined a bright light on this steady cash machine.
We acquired our position in RSG for $71 per share in April of 2020 when the market was near its covid bottom and high-quality compounders – such as RSG – were for sale on the cheap. Today, RSG trades for $126 per share and has a dividend yield of 1.5%. In our opinion the company is the best operator in the waste disposal and recycling business.
RSG owns several irreplaceable landfills that will generate high returns for the foreseeable future. Landfills benefit from limited competition as it is extremely challenging to permit and develop competing sites due to the not-in-my-back-yard or “NIMBY” movement. These landfills typically generate superior returns in strong homebuilding environments as the home construction and renovation process generates substantial waste.
Additionally, RSG operates a large waste collection business (think garbage trucks) that benefit from long-term contracts with municipalities with contracts that are linked to CPI. So besides being a great business that generates high returns on capital, their revenue is directly linked to inflation and rises correspondingly.
Below is a table of our top and bottom contributors for the third quarter.
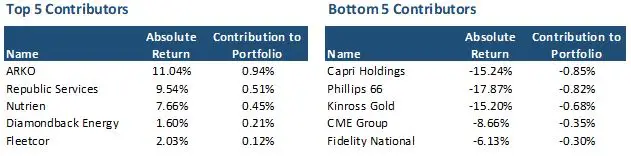
On the negative side of the ledger, we saw weakness in Phillips 66 (PSX). Our ownership of PSX has been mixed to date. Over the last decade the company has been considered one of the premier refiners in the United States. They had historically allocated capital better than their peers and generated industry leading returns. They were rewarded by investors with the highest valuation multiple in the industry.
However, the refining industry has struggled during the covid pandemic as demand for refined product collapsed with quarantines and stay-at-home orders. PSX’s issues were compounded by weakness in their large midstream and chemical businesses. Additionally, a series of hurricanes over the summer of 2020 and 2021 have had devastating impacts on their gulf coast refinery network relative to their more geographically diversified peers.
For investors, it is important to remember that the exceptional management team at PSX that historically generated industry-leading returns on capital remains in place, and the company is poised to profit from a recovery of energy demand and refined products. We believe the company is materially undervalued and should be worth $100-$130 per share given current commodity prices and crack spreads (the profit refiners make converting crude oil into gasoline, diesel, and other refined products). Their chemical business has a feedstock price advantage and is well positioned to benefit from improving demand. The share price of PSX was $70 at the end of the quarter and has rebounded to $82 as of this letter.
Turning to trading activity in the quarter, we made the decision that the time is right to exit our position in Royal Caribbean (RCL). The cruise line was one of our favored positions prior to covid and we stuck with this name through pandemic and even added to our position as the stock fell from $100 to $20. Ultimately, we did slightly better than breakeven during our ownership of RCL.
We made the decision to sell RCL as the return to pre-pandemic operating levels continuously gets delayed. We would have thought given the return to flying, leisure travel, and hotel occupancy, that cruises would similarly be back to decent occupancy and profitability by now. However, the recovery in cruising has lagged the rest of the leisure industry as government around the world have been especially punitive to the industry.
Prior to covid, RCL was the best cruise operator with the most efficient fleet and most importantly, a superior balance sheet. However, now the tables have turned significantly for RCL. Their capital structure has completely flip-flopped over the last year and a half. At the end of 2019, RCL’s market cap was $28 million, and their debt was just $12 billion. In stark contrast, the current market cap is $21 billion, and their debt is a staggering $22 billion. We strongly believe that cruising will return and RCL will emerge solvent as the best operator in the industry. However, the current price near $90 is not as attractive as it once was. We are reluctant sellers, but we welcome the opportunity to revisit RCL in the future at a more attractive share price.
Turning to new positions, in August, we initiated a stake in Fidelity National Information Services (FIS). The company is the leading software provider to the banking industry with critical processing applications. This business has EBITDA margins of roughly 40% and is growing mid-single digits as more facets of bank operations are digitized. Their software provides mission critical operating functions for banks which creates large barriers to entry for competing firms. Their contracts have multi-year terms and very high renewal rates.
FIS is also the largest electronic payment processor in the world following a series of acquisitions. They primarily compete with JP Morgan, First Data Corporation, Bank of America and Global Payments to provide credit and debit card processing on behalf of banks. This business is very attractive with EBITDA margins in the 45-50% range. It has also benefited from strong secular tail winds as more payments are completed with credit instead of cash, which should continue as credit and debit cards respectively account for just 28% and 27% of total purchases. However, competition is increasing as new fintech companies compete for market share.
In fact, news of PayPal’s proposed acquisition of Afterpay (a buy-now pay-later fintech) caused stock selloffs for all merchant providers including FIS. The selloff in FIS shares accelerated the next day as the company missed earnings expectations in their merchant processing unit. However, this created an opportunity for us to take a new position in the company at approximately $128 per share. We believe the reaction to both events was overblown as merchant processing represents just 30% of FIS revenues and secular tailwinds from declining cash usage will support their business even with rising competition. Essentially, FIS’s piece of the merchant processing pie is shrinking, but the total pie is growing at a much faster pace than any share loss.
We believe the normal earnings power of FIS over the next 2-3 years will be between $7-$8 per share when excluding purchase accounting amortization and integration costs. We expect revenues to grow in the high-single digits with mid 40% EBITDA margins. Leverage is elevated but manageable with $18 billion in net debt representing 4.5x turns of leverage. The company will use free cash flow to reduce this number back to 2x, while maintaining a 1.2% dividend yield. The debt is well termed out with an average coupon of just 1.7%. FIS is a high-quality business with above average growth, margins, and competitive advantages. We believe shares should trade between 18-23x normal earnings power representing an intrinsic value of $130-180 per share.
At the end of the quarter, we also purchased a new position in Altice USA (ATUS). The company is a cable provider in the northeast and south-central United States. They provide broadband and cable TV services through fixed fiber and cable networks to homes and businesses. Over the past few years, the company has grown through acquisitions and capital investments by expanding their footprint and upgrading their service from traditional DOCIS cable to high-speed fiber networks.
The company generates $1.5 billion in free cash flow that should grow as they invest to expand their network. On their second quarter earnings call, the CEO said subscriber growth would decline in the third quarter due to customers impacted by flooding from Hurricane Ida in the Northeast. They also saw delays in new neighborhood construction in Texas due to unfavorable weather and delays from material shortages. The stock promptly fell from $35 down to $20, where we initiated our position.
This is the first cable operator we have owned in the portfolio as they have generally traded for rich valuations. When we acquired our shares of ATUS they were trading for an industry low of 7x enterprise value to EBITDA. We believe shares will ultimately recover as subscriber growth recovers in Q4 or Q1, and investors recognize the favorable returns in their investments in new fiber deployment. We believe shares are worth $30-$40, representing an excellent return form our initial purchase price of $20.
Lastly, we wanted to revisit the Investment Philosophy of the Concentrated Value Portfolio. We utilize a value investment strategy that seeks out companies for investment which the Portfolio Manager deems to be high quality companies. Quality is defined by possessing business operations with durable competitive advantages, allowing for high returns and growing cash flows streams. We want these high-quality companies to also have solid balance sheets, preferably with a net cash position. We also prefer that their management teams make decisions with an emphasis on maximizing shareholder returns.
Once we find these high-quality companies, we generally only invest in their stock if they trade at a steep discount to our estimate of their intrinsic value. This is necessary to provide our investors the opportunity to generate an above market return and protect capital. This discipline creates a wide margin of safety if an undesirable scenario plays out in the future. Pelican Bay Capital Management believes that identifying a significant difference between the daily market value of a security and the intrinsic value of that security is what defines an investment opportunity.
Dynamic Income Allocation
The Dynamic Income Allocation Portfolio (DIAP) was remarkably flat this quarter, representing a nice port in the storm as market volatility returned in September. The average daily change in the DIAP was just a single basis point (0.01%). Amazingly, there were only 8 trading days in the quarter where the DIAP moved greater than 50 basis points up or down. The largest daily move was -1.01%.
For the quarter, the portfolio was down marginally at -0.49%. The DIAP continued to meet its mandate of low volatility with a daily standard deviation of just 0.36%. For the quarter, the Sharpe ratio came in a -0.3x, below our normal range of 1.5 plus that we have experienced each quarter since Q1 2020.
However, this is mostly a result of quirky math as the S&P 500 Index has a slight positive gain of 0.6% relative to our result of -0.5%. With returns not far from flat, a 1.1% miss relative to the index, resulted in our negative Sharpe ratio. Interestingly, the monthly Sharpe ratio for July, August, and September each exceeded 1.4x.
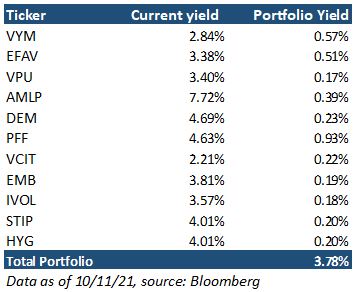
Turning to the performance of individual asset classes there was similarly very little fluctuations in returns across the board. The biggest winner was our TIPS spread and volatility ETF (IVOL) with an absolute return of 1.77%. While our largest loser was emerging market equities (DEM) that fell 2.31% on a rising dollar. As you can see in the table below, it was a very quiet quarter for our portfolio with none of our asset classes contributing more than 12 basis points to our total return. Most of our holdings didn’t stray very far from even.
In light of these tame results, the bigger news this quarter is that we will be slightly modifying our portfolio allocation when we rebalance in October. We continue to see evidence that inflation is proving less than transitory. We also saw interest rates charge upwards in the closing weeks of September and into early October. These increasing rates are headwinds for our fixed income assets that currently represent 30% of the portfolio. Yields on 10-year US Treasury bonds have increased from 1.3% on September 23rd up to 1.6% as of this writing. We think this increase is a result of the Federal Reserve indicating they are prepared to taper their quantitative easing programs and investor recognition that inflation isn’t transitory.
To better protect our portfolio should these elevated inflation trends persist; we are making two changes in our allocation model. First, we are swapping our 5% position in Mortgage REITs (REM) for a new allocation to Energy Master Limited Partnerships (AMLP). Our investment in REM was very successful and returned 42% with dividends since our purchase in November of 2020.
When we made our purchase of Mortgage REITs, they were trading for roughly 0.7x book value with a dividend yield above 7%. We believed these assets were greatly undervalued. Moreover, at the time, we thought they were poised to benefit from a steepening yield curve and improving mortgage fundamentals.
After the run up in share price, they are no longer as attractive of an investment. Today, Mortgage REITs trade at a premium and the yield on REM has fallen below 5%. This represents the lowest yield on these assets in over a decade. Remember: yields down = price up.
Additionally, the Federal Reserve has been purchasing $480 billion worth of mortgage-backed securities on an annualized basis as part of their quantitative easing program. In our estimate, this flood of money has likely driven the price of mortgage-backed securities above their fundamental value, benefiting our Mortgage REITS. As the Fed begins to taper and reduces these purchases, this tailwind will flip to a headwind, and should reduce book values of Mortgage REITs as the value of their portfolios decline.
Needless to say, REM has been a rewarding investment for us, but it is time to seek greener pastures. In its place we are initiating a new position in Energy MLPs. These assets have rebounded substantially from their lows in April 2020 when energy markets collapsed. In the interim, the marginal operators went bust and the survivors have curtailed debt and capital expenditure plans, boosting cash flows available to shareholders. Additionally, it has become clear that finished products will rebound entirely and US production in the Permian will stabilize around pre-covid production levels. Natural gas prices have also finally breached the $4 level and MLP’s that have gas price-linked contracts or fractionating units are poised to earn a decent return on their assets for the first time in seven years.
We believe there is more upside for MLPs as they remain undervalued and their current yield of 7.7% is very attractive. We think MLP distributions could increase in the coming quarters. These MLP’s will also benefit if commodity price inflation accelerates, offering shareholders an added benefit and uncorrelated return.
Secondly, we will be reducing our position in intermediate-term corporate bonds (VCIT) to 10% from 15% previously. VCIT is the lowest yielding asset class in our portfolio at 2.2%, and these are the highest duration assets in the fixed income portion of our portfolio; meaning they would decline the most in a rising rate environment all else equal.
We will reallocate this 5% of the portfolio to short-term 0-5 year Treasury inflation securities, or TIPS. These assets have a current yield of 4.0% and could increase if the consumer price index (CPI) stays elevated or rises further. TIPS also have a very low correlation to the balance of the portfolio, which should reduce the total portfolio volatility. In short, this change will increase our yield, reduce our volatility, and protect us better should the current trend of rising inflation persist.
Below is a table detailing the changes to the DIAP Portfolio.

Taking into consideration the updated portfolio allocation, the current yield on the DIAP stands at 3.8% as of this writing. The dividend yield for the DIAP remains at a healthy premium to US treasuries which are currently yielding just 1.5%, representing a 2.3% spread over treasuries.
Lastly, it is important to reiterate the investment philosophy of the Dynamic Income Allocation Portfolio. The DIAP is designed to function as the core foundation of an investor’s portfolio by operating with the dual mandate of generating the highest current income possible while preserving capital.
Pelican Bay Capital Management attempts to achieve this dual mandate by only investing in asset classes that by themselves offer a current dividend yield that is greater than either the dividend yield of the S&P 500 or 10-year U.S. Treasury. In our view, elevated income can add stability to a portfolio and maximize the benefits of compounding through reinvestment.
We then construct a portfolio of these high-yielding asset classes with an emphasis on minimizing correlation of the overall portfolio and maximizing its diversification beyond the typical 60/40 stock/bond portfolio. We finally add a valuation overlay that we utilize across all our portfolios. We allocate a larger position weighting to the most undervalued and attractive investment opportunities, while avoiding owning overpriced assets.
Phoenix Fund
Please note: The Phoenix Portfolio is only available to “Qualified Clients” pursuant to section 205(e) of the Investment Advisors Act of 1940 and section 418 of the Dodd-Frank Act.
The Phoenix Fund had a total return of -1.8% this quarter. For the second quarter in a row the portfolio’s return can be chalked up to a strong performance from Urban One. After jumping 138% in Q2, it advanced another 36% in Q3. This quarter’s gains from Urban One were magnified by the fact that it was our largest position coming into the quarter. Cumulatively, in the last two quarters Urban One has contributed towards 1,280 basis points of positive performance attribution. The only consequence of this strong performance is that we must continuously trim our holdings as it keeps bumping into our single position size limits that we deploy to manage risk. In the third quarter, the average price we received from trimming our position was $6.62 per share. As reference, our average purchase price was just $2.21 per share.
While Urban One had stellar performance, it wasn’t enough to offset this quarter’s detractors. The remainder of the portfolio was choppy with the losers outpacing the winners. We saw pullbacks in companies like ADT, RR Donnelley, and Whole Earth Foods. These companies had strong performance in the first half of the year and were each in the list of top 5 contributors from the second quarter. In the short run, these retracements after periods of strong outperformance are not unusual or unexpected. We believe these stocks are materially undervalued and we would expect their shares to increase over the coming quarters.
In fact, after the Q3 close, RR Donnelley received a buyout offer from their largest shareholder for $7.50 per share. This compares to $5.10 per share price at the end of the quarter. We are happy to see this stalking-horse bid for the company and hope it attracts another suitor who is willing to pay even more. We believe the shares are worth $8-14 and would hope to see a transaction of at least $10. For reference, our average purchase price is $4.36.
Our top 5 and bottom 5 contributors to returns can be found in the table below.
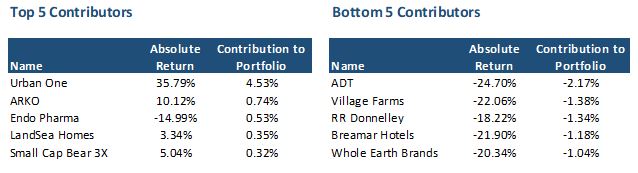
Please note that the negative absolute return for Endo Pharmaceuticals is not a misprint. We reinitiated our position in Endo in early July for $3.50 per share. The shares had fallen from as high as $10 in early 2020 as the company received a negative summary judgment in their opioid case in Tennessee that could have resulted in a material financial penalty. We believed, if the summary judgment went forward, Endo would be forced to restructure, and Tennessee would see their claim whittled away in bankruptcy court.
In our analysis, States and municipalities who are suing Endo would maximize their settlement payouts if they don’t drive the company into bankruptcy and avoid fighting over scraps with debtholders in court. Thus, in our estimation there is a high probably that Endo’s outstanding opioid litigation is ultimately settled at a manageable cost of $1.5-$3 billion. We would expect these payments to be spread over a decade or more, and easily serviceable from existing cash and future cash flows. Under this outcome, Endo will avoid a bankruptcy restructuring and their plaintiffs would maximize their claims.
Only a few days after we established our position, the plaintiffs in the Tennessee case settled for just $35 million and the stock quickly rocketed above $5.00 per share. We took advantage of the quick gain and sold approximately a third of our position for an average price of $4.86.
However, these gains were short lived as a judge in a similar case in New York indicated he was prepared to rule for a summary judgment too, once again putting the company at risk. Shares quickly fell to almost $2 per share. We expected the same result as the positive outcome in Tennessee and we rebuilt our position bringing our total average purchase price down to $3.16 per share. Ultimately, New York reached the rational conclusion, and settled for $50 million rather than pursing a damaging summary judgement. Endo’s stock recovered to $3.40 by the end of the quarter. This is how we were able to turn a negative absolute return of -15% into a gain for our investors. As more cases settle, we would expect Endo to move closer to its intrinsic value that we estimate is between $8-$12 per share.
Endo was our only new position in the third quarter. The remainder of our purchase activity consisted of buying the dips in various names including PG&E Corp, LandSea, and RR Donnelley. At the end of the quarter the portfolio had 20% in cash, and we are on the hunt for new names.
As for divestments, we exited our position in Diamondback Energy (FANG) on success. We used FANG as a proxy to benefit from rising energy prices. We almost doubled our money buying the stock in the mid $50s and selling it for $98 per share. The only drawback was that FANG was a smaller position as it sat in our “trading bucket.” The company didn’t meet our normal investment criteria of a sub-$10 stock price or evidence of forced liquidation. However, we invested in FANG because in November 2020, we believed it was the best proxy for oil exposure available in the market. Fortunately, it’s shares have outperformed both oil prices and its large cap E&P peers.
We remain very bullish on energy prices and still retain our position in Gran Tierra Energy (GTE). When we apply an $80 oil price to our models, we get valuations for GTE that are 3-5x greater than its current share price. Many other distressed oil companies have bounced nicely on the recent oil price rally. Unfortunately, GTE’s stock price did not participate in this recovery, but valuation discounts this large usually don’t last too long.
Finally, we wanted to revisit the investment philosophy of the Phoenix Fund. The portfolio takes advantage of structural biases against institutional ownership of financially levered companies with low-stock prices. We seek companies that have had their stock prices fall 70% or more in the last two years and are priced below $10 dollars per share. This outcome typically leads to forced selling from their institutional shareholders, creating the opportunity to make outstanding investments for less constrained investors.
Generally, these companies are under distress from poor performance caused by what we believe are temporary factors. These companies typically have elevated levels of debt, and any prolonged period of business stress could cause stockholders to endure substantial losses. The Phoenix Fund is a high-risk, high-return investment strategy. Please see the Risk of Loss Section of Part 2A of Form ADV referenced below.