To view this letter in PDF Format please click here: 2021-Q1 PBCM Investor Letter.pdf

Dear Investors,
We would like to begin by welcoming our new investors to our funds and thanking our existing investors for their continued support. We are very pleased to report that we once again delivered outstanding risk-adjusted returns for the first quarter of 2021. We continue to build on the momentum from the latter half of last year and deliver on our investment mandates.
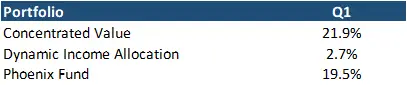
The results for each portfolio for the first quarter are presented in the table below.
While it is early in the second quarter, we have seen many of the beneficial tailwinds driving our recent performance carry over into April. We believe our portfolios are well positioned for the current market environment and we are proactively managing risk levels should asset prices come under pressure.
The layout of this quarter’s letter will start with a general market commentary, followed by individual reviews and analysis of each of our portfolios including Concentrated Value, Dynamic Income Allocation, and the Phoenix Fund.
As always, if after finishing this letter you have any questions or would like to discuss any topics in greater detail, please do not hesitate to call us at 239-738-0384 or send an e-mail to tyler@pelicanbaycap.com. We welcome your feedback and look forward to your correspondence. Additionally, we encourage you to share this letter with as many friends and colleagues as you like.
Market Commentary
The rotation in market leadership that emerged in November in the wake of the US election and successful covid vaccine trials carried into the first quarter of 2021. There was an unusually wide dispersion in returns across the asset class spectrum this quarter. Commodities and small-cap equities delivered outstanding double-digit returns, while growth stocks, gold, and bonds fell. Long duration US Treasury Bonds were the worst performer, suffering a 14% loss, which is multiples of the paltry yields offered to holders of these supposedly “risk free” investments.
The wide outcomes in the markets during the first quarter can be summed up into three main themes, each of which we will discuss below. These themes are:
- The transition of market leadership and momentum to value versus growth stocks, often characterized as the “reopening trade” or “reflation trade”.
- Increasing long-term interest rates and the accompanying steepening yield curve.
- Mounting evidence of investor euphoria in more speculative areas of the market.
The strong performance of “reopening stocks” we witnessed in the first quarter should not have surprised anyone. If we learned anything over the past year it is that markets are forward looking, and they thrive on fiscal and monetary largess. The market has sniffed out higher future interest rates, continued fiscal stimulus, and a rebound in demand for all the things consumers have been denied over the past 12 months – travel, dining out, live entertainment, etc. Financials, energy, and consumer discretionary stocks increased considerably after lagging the market in 2020. The concentration of these sectors in value indices contributed to the largest quarterly outperformance of value relative to growth since 2001.
Conversely, the mega-cap growth stocks treaded water while the covid beneficiaries tumbled. Zoom, Teladoc, Peloton, and Netflix were all in the red. In fairness, these companies have crushed it since the emergence of the pandemic, and their valuations have risen sharply as investors piled into the few winners that benefited from the crisis. It is still too early to confidently forecast what our post-pandemic economy looks like, and which of our newly adopted habits will persist in a covid-free world. However, we would not be surprised to see these stocks continue to lag as more Americans are vaccinated and resume “normal” activities and pre-covid habits.
Additionally, growth stocks could face further headwinds if interest rates continue to rise, resulting in a contraction of their valuation multiples and lower stock prices. Growth stocks often have higher valuation multiples than the market as current income is generally small or even negative (which is why they are often valued on revenues). Investors are willing to pay lofty prices for these fast growers as they are valuing the company on the future profits they might achieve. Profits are expected to be much higher from the combination of exponential growth and operating leverage from presumed scale or network effects. As interest rates fall – like they have for the last decade – the net present value of these future expected profits increases. Conversely, if interest rates rise, then these future profits are worth less, and their associated values should fall.
One of the surprises of the first quarter was the magnitude of the jump in interest rates. The yield on 10-year treasury bonds began the year at 0.91% and had climbed all the way to 1.74% by the end of the quarter. This represented the largest quarterly percentage increase in yields since 1983. Yields are rising from a combination of accelerating economic growth and fears of inflation (a topic we cover in depth below).
This jump in long-term yields occurred despite the Federal Reserve maintaining overnight rates at 0%. There is some speculation as to how high the Fed would allow long-term rates to rise before they actively try to push them lower. They could attempt to do so using two methods. First, the Fed could re-launch Operation Twist (they did this after the financial crisis), where they shift their large bond purchases from short-term notes to longer-term bonds. Currently, the Fed is purchasing $80 billion of short-term notes per month as part of their quantitative easing program.
Secondly, the Fed could deploy a new strategy called Yield Curve Control, where they set a specific target for long term rates much as they do short-term rates today. They would achieve this by purchase bonds in the open market until they overwhelmed other buyers and drove the yield down to their target rate. This would be a major departure from normal Fed operations and it’s not clear if it would work or what the unintended consequences could be. The Reserve Bank of Australia initiated Yield Curve Control in February, so it is not without recent precedent.
Why should investors care? Interest rates are effectively the price of money that underpins the valuation of all financial assets. If the Fed proves capable of controlling and lowering long rates, it would be beneficial for growth stocks and bonds, and detrimental towards sectors like financials. It could reverse the reflation trade that has dominated market action since November and benefited our portfolios. We will be closely monitoring the Fed for any indication they intend to launch either Operation Twist or Yield Curve Control. Should they do so we are prepared to respond accordingly.
In addition to increasing interest rates and potential Fed intervention, investors should also be concerned about the increasing speculative euphoria that was on full display in the first quarter. The emergence of “Meme” stocks such as Gamestop, AMC, and Koss among others was extraordinary. The associated stock volatility and trading volumes were unlike anything we have seen in the markets before. While it is too early to understand exactly what happened, it appears that retail investors may have been successful in pooling resources to utilize a complex call option strategy to manipulate the stock price of several companies.
Regardless of what happened, the activity in these “Meme” stocks captured the zeitgeist of the retail investor. While market valuations have been elevated for a few years, widespread participation by retail investors had been largely absent until now. In the first quarter, retail trades accounted for 25% of all volume on US exchanges, up from a normal level of approximately 10%. Call option open interests held in retail accounts also shattered records. These elevated levels of retail participation are reminiscent of 1929 and 1999 periods and suggest a higher likelihood that we could be in a stock market bubble.
Additionally, there are many other signs of speculative excess that are associated typically with over-extended markets.
- In the first quarter of 2021, there was approximately $100 billion in capital raised via special purpose acquisition companies, otherwise known as SPACs or “blank-check” companies. This compares to $80 billion raised in all of 2020, which itself was a blow-out year for SPACs. SPACs essentially allow private companies to come public without the typical scrutiny of institutional investors or the SEC that is provided in the normal IPO process. SPACs by their very nature can only thrive in an environment with speculative capital.
- Money raised through IPOs in 2020 also exceeded the prior records set in 1999. Private companies – often with no profits – are racing to the markets to capitalize on the elevated valuations prevalent in today’s markets. Moreover, the average daily increase (or pop) in IPOs on their first day of trading was 38%, once again reminiscent of the Dot Com Bubble in 1999. This is well above the normal level of 18% according to research by Jay Ridder of the University of Florida.
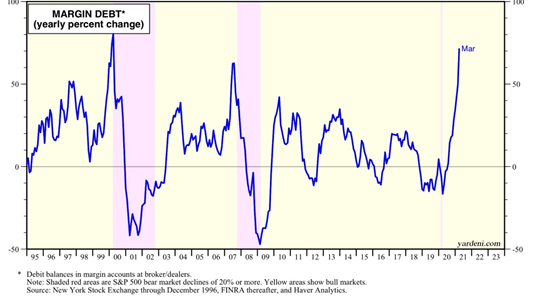
- In the first quarter, margin loan debt held at securities firms reached a new record with approximately $600 billion in loans outstanding to investors. More troubling, the year-over-year growth in margin debt is near 70%. The last two times we have seen growth in loans at these levels was the 4th quarter of 1999 and the third quarter of 2007. The following chart displaying this data provided by Yardeni Research is alarming.
- Crypto currency appears to be in a mania. While we can understand the investment case or use case for some crypto currencies such as Bitcoin and Ethereum; Dogecoin was intentionally designed as a joke with absolutely no real use cases. Yet as we write our letter the market cap of Dogecoin has hit $50 billion, on par with Fortune 100 companies like Ford or Kraft-Heinz. Of course, this is nothing short of absurd.
To be clear, we are not calling for a market top or predicting the immediate collapse of what could be a bubble in asset values. We are certainly not suggesting investors sell everything and go to cash. Bubbles are notorious for carrying on much longer than many would have expected. We are simply bringing attention to the fact that current valuation metrics are in the top 5% of historical observations and that there are several red flags associated with activities that only appear near market peaks. Please proceed with caution.
These observations should provoke a response on behalf of investors to be more thoughtful about risk. We would recommend trimming, hedging, or taking profits in more speculative investments. We would lean towards buying higher quality companies with solid balance sheets. At Pelican Bay, we are taking this opportunity to reduce the riskier components in each of our portfolios and keeping an eye out for any deterioration in investor psychology.
The case for inflation and its risks
We are seeing mounting evidence that inflation could finally materialize after being dormant for most of the last decade and in secular decline since the early 1980s. While we are not trained economists, we see two critical observations that appear clearly inflationary to us.
First, the pandemic and corresponding fiscal support has created an unprecedented mismatch between supply and demand. Government stimulus has allowed consumers to continue spending at elevated rates despite the closure of the economy and associated lost income. At the same time, initiatives to reduce the spread of the virus or fears of being diagnosed have resulted in a decline in production, labor input, and factory utilization. Macro 101 suggest that prices go up when demand exceeds supply.
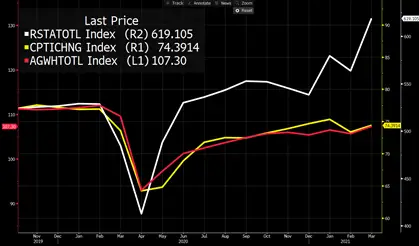
As observed in the chart above, monthly US retail sales (the white line) have been above pre-pandemic levels since June of 2021. As of the most recent reading in March, US retail sales are 17% above pre-pandemic levels. For reference, annual retail sales growth is in the 2-5% range. Fiscal stimulus support is driving this record growth in consumption. Yet at the same time factory utilization (the yellow line) and aggregate hours worked in the US (the red line) are still below pre-pandemic levels.
This mismatch is why we are seeing shortages across many consumer sectors and corresponding higher input prices. In March, the Purchasing Manufactures Index (PMI) of input prices jumped 4.5% year-over-year. Companies are loudly complaining about higher input costs on their earnings call. More troubling, they are discussing passing these cost burdens on to consumers through offsetting price hikes or the discontinuation of normal discounts.
Second, the United States is a net import country where much of our consumer goods are imported from places like China, Canada, and Europe. Since February 2020, the US dollar has declined by 7%, 5% and 8% versus these respective currencies. As the dollar declines our purchasing power of imports from these countries weakens and we pay more for goods originating from these places. This is a material change from the last few years where the dollar had been strengthening.
You will note that we did not mention money supply or quantitative easing as reasons justifying higher inflation. Frankly, we can find no evidence to support these assertations. But the undersupply of goods relative to demand and a falling dollar are unquestionably inflationary. The most recent data released in the CPI (+2.6%) and PMI (+4.5%) suggest that inflation is already here.
As year-over-year economic data points begin to lap the anemic comparable data from the prior year in April, May, and June, it is entirely reasonable that we may see inflation data jump based on easy comps alone. It is simple arithmetic. At the very least it could cause interest rates to move higher on a temporary basis in the coming quarters. At worst, inflation can be a self-fulfilling prophecy driven by consumer psychology and expectations. Should this temporary data anomaly creep into long-term expectations, it could ultimately result in demands for higher wages by labor. The risk is that inflation could be higher and more enduring than the current consensus.
While it is still too early to make such a call, it is our belief that the cost of betting inflation is temporary and being wrong is a considerably worse outcome than betting inflation will materialize when it doesn’t. This suggests that the proper response from investors would be to place more emphasis on understanding the inflationary risks in their portfolio. It would be wise for investors to consider reducing some exposure to investments that may do poorly in inflationary environments.
Concentrated Value
The Concentrated Value portfolio had another outstanding quarter. The total return for the portfolio was 21.9% in the first quarter, 15.7% better than the 6.2% total return of the S&P 500 index. Our portfolio continues to benefit from the “reopening trade” that emerged in November of last year. Economically sensitive stocks such as energy and consumer cyclical stocks were sources of strength.
Our energy holdings represented nearly half of our gains with the sector contributing 9.8% of our total return. We struck a gusher with our position in Texas Pacific Land (TPL), a royalty trust company with landholdings across Texas. As we mentioned in our last letter, TPL drills no wells and does not have the capital burden of the typical oil driller. Instead, they own royalties on every barrel of oil that other companies pump on their landholdings.
We acquired TPL for $547 per share in November of 2020. The stock quickly spiked to $1,700 per share in March. We began trimming our position at $1,200 and realized an average sales price of $1,485 per share, representing a 171% total return. While we are reluctant sellers, we estimate that oil prices would have to sustain above $100 per barrel to justify TPL’s stock price at these levels. The stock price is simply way ahead of any reasonable fundamentals.
We are still believers in higher energy prices in the coming year as covid-impacted economies continue to reopen and normal transportation activity resumes. Our analysis suggest anywhere from 3-4 million barrels of pre-pandemic oil production capacity has been materially impaired and can’t be brought back to the market in any reasonable time period. Should oil demand rebound to prior levels we would experience a period of significant undersupply and presumably much higher commodity prices. As we said in last quarter’s letter, we believe energy stocks could be one of the best performing stock sectors in 2021.
With this outlook in mind, we wanted to maintain an elevated exposure to energy producers, and we reinvested a portion of our proceeds from TPL into EOG Resources (EOG). EOG is the largest oil producer in the US with significant acreage holdings in the heart of every large shale play in the country. They are often called the “Apple” of the oil industry, as they have automated many critical processes of their operations through software and real-time data analytics. Their landholdings in Tier 1 acreage combined with industry leading operational efficiency have resulted in one of the lowest drilling costs of any energy company in the US. EOG’s low-cost operations allowed the company to remain profitable in 2020 despite crashing oil prices.
Interestingly, despite the large run-up in energy stocks since November, EOG’s share price gains have lagged those of peers. We believe the stock is currently discounting oil prices in the upper $50 per barrel range. If oil prices move to $70, which is not too far from the current price of $63, then shares of EOG could be worth $90-$100. We acquired our position for $70 per share.
Another major winner in the first quarter was Teradata. We acquired our position in Teradata for $23 per share in late December. Our investment premise was based on our estimate that Wall Street wasn’t correctly accounting for Teradata’s transition from a perpetual software license revenue model to a ratable subscription SaaS model. These transitions can wreak havoc on GAAP financial statements and make the company’s performance seem lousy relative to reality.
Once other investors realized earnings were artificially depressed by accounting rules, we thought Teradata stock could trade as high as $40 in a few years. It turns out we drastically underestimated Wall Street. As Teradata announced Q4 earnings and provided 2021 guidance on their February 4th conference call, the stock subsequently spiked 120% in two days. We have never seen a stock re-rate so quickly. We took advantage of the buying frenzy and exited our position for $47 per share.
The only real negative contributors to the portfolio in Q1 were gold miners and utilities. Gold prices fell 11% in the first quarter and miners fell in sympathy with the commodity. Gold prices declined as perceived real interest rates rose as the 10-year Treasury rate jumped from 0.9% to 1.7%. At the same time, reported inflation measures remain subdued in Q1 causing the real rate (US treasury less measured inflation) to rise.
However, as inflation measures begin to lap the deflationary shock from the initial shut down of the economy March, April, and May of last year, we would expect real rates to decline again (as they did in the first half of 2020) and gold prices should move higher. Gold prices perform best when real rates are negative and declining. The most recent reading of the consumer price index (CPI) in April was 2.6%, implying real rates have declined to -1.0%, which is positive for gold prices.
The newest position in the portfolio is Arko Corp. Arko is the sixth largest operator of convenient stores in the United States. The company recently came public through a SPAC. Convenience stores are fabulous businesses that generate attractive returns on investment with steady cash flows that are often recession resistant. The industry has reliably grown sales at 3.6% over the last decade. Importantly, there are material benefits to scale from purchasing fuel and in-store consumable goods such as food, alcohol, and tobacco. We believe that Arko is a compounder that is poised to double their value in the next 3-4 years. They will achieve this tremendous growth through a combination of acquisitions and store remodels.
Arko’s acquisition strategy is particularly compelling as they can acquire convenient stores in less dense secondary markets for 3-4x post synergy cash flows. This representing a substantial discount to their publicly traded peer valuations which can be between 8-14x. The CEO is a serial acquirer who is considered one of the best operators in the industry. Over the last 7 years they have made 18 acquisitions growing EBITDA at Arko from $14.6 million to $150 million. There is plenty of runway for industry consolidation as there are 150,000 convenience stores in the U.S. and the top 10 chains control just 20% of these locations. Arko has plenty of liquidity to do deals after the SPAC capital raise with $300 million in cash and $240 million available on their line of credit.
The CEO rolled 90% of his ownership into the SPAC conversion and the private equity sponsors of the predecessor company are rolling 100% of their investment. Arko also received a $100 million dollar investment from Michael Dell’s family office that substantially decreased the potential share dilution from the SPAC conversion. We acquired our position for just under $10 and we believe shares are worth $20 per share. We also believe that Arko can grow cash flows at 20% or more for several years and we will likely ride this wave unless shares become substantially overvalued. It’s rare to have an opportunity to invest in a business that has a great management team with sustainable double digit cash flow growth potential.
Lastly, we wanted to revisit the Investment Philosophy of the Concentrated Value Portfolio. We utilize a value investment strategy that seeks out companies for investment which the Portfolio Manager deems to be high quality companies. Quality is defined by possessing business operations with durable competitive advantages, allowing for high returns and growing cash flows streams. We want these high-quality companies to also have solid balance sheets, preferably with a net cash position. We also prefer that their management teams make decisions with an emphasis on maximizing shareholder returns.
Once we find these high-quality companies, we generally only invest in their stock if they trade at a steep discount to our estimate of their intrinsic value. This is necessary to provide our investors the opportunity to generate an above market return and protect capital. This discipline creates a wide margin of safety if an undesirable scenario plays out in the future. Pelican Bay Capital Management believes that identifying a significant difference between the daily market value of a security and the intrinsic value of that security is what defines an investment opportunity.
Dynamic Income Allocation
The Dynamic Income Allocation Portfolio (DIAP) once again generated excellent risk-adjusted returns in the first quarter. The total gain for the DIAP including dividends was 2.7%. These results outperformed the 2.4% potential return from our 60/40 stock-bond benchmark. The portfolio also generated extraordinarily low levels of realized volatility with average daily moves of just 0.03% and a standard deviation of 0.48%. Amazingly, even with a return of just 2.7%, the portfolio delivered a Sharpe Ratio of 1.5x.
The portfolio has now demonstrated 4 straight quarters of elevated sharp ratios as we delivered strong positive returns with low volatility. The changes we made to the portfolio construction methodology in the first quarter of 2020, including new rules around position weights, have enabled us to deliver these excellent results and get the portfolio back on track over the last year. We are enormously proud of these results and delivered on our mandate to investors of providing elevated income while minimizing volatility.
After making significant portfolio allocation adjustments in the third and fourth quarters of last year, this quarter was relatively quiet. We did not make any tactical changes this quarter. We maintained our target allocations from November and rebalanced the portfolio back to those target weightings in early April.
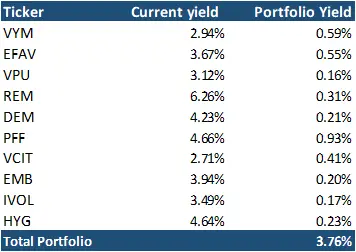
Turning to performance, the best performing asset class for the second quarter in a row was Mortgage REITs which gained 13% contributing to 0.7% of the quarter’s gain. Mortgage REITs were tremendously undervalued at the time of our purchase and they are poised to benefit from a steepening yield curve and economic recovery.
Our position in US Dividend Stocks was the largest contributor to our return with 2.3% impact to the portfolio as the asset class increased 11.2%. We expect outperformance from these value-oriented stocks to continue, at least in the near term, as they remain undervalued and typically perform well during times of economic recovery. The performance of each asset and its contribution to the portfolio can be found in the table below.

The laggards in the quarter were our Intermediate-Term Corporate Bonds and Emerging Market Bonds which had returns of -5.5% and -3.9% respectively. Bond prices fell as interest rates jumped in the first quarter (recall that prices and rates have an inverse relationship). Emerging Market Bonds also suffered from a strengthening dollar in the first quarter. It is important to note that the duration of our bonds investments remains low as we believe the probability for rates to continue rising is elevated.
The current yield on the DIAP stands at 3.8% as of this writing. The dividend yield for the DIAP remains at a substantial premium to US treasuries which are currently yielding just 1.6%, representing a 2.2% spread over treasuries.
Lastly, it is important to reiterate the investment philosophy of the Dynamic Income Allocation Portfolio. The DIAP is designed to function as the core foundation of an investor’s portfolio by operating with the dual mandate of generating the highest current income possible while preserving capital.
Pelican Bay Capital Management attempts to achieve this dual mandate by only investing in asset classes that by themselves offer a current dividend yield that is greater than either the dividend yield of the S&P 500 or 10-year U.S. Treasury. In our view, elevated income can add stability to a portfolio and maximize the benefits of compounding through reinvestment.
We then construct a portfolio of these high-yielding asset classes with an emphasis on minimizing correlation of the overall portfolio and maximizing its diversification beyond the typical 60/40 stock/bond portfolio. We finally add a valuation overlay that we utilize across all our portfolios. We allocate a larger position weighting to the most undervalued and attractive investment opportunities, while avoiding owning overpriced assets.
Phoenix Fund
Please note: The Phoenix Portfolio is only available to “Qualified Clients” pursuant to section 205(e) of the Investment Advisors Act of 1940 and section 418 of the Dodd-Frank Act.
We had another quarter of strong performance from the Phoenix Fund. The total return was 19.5% for the first quarter, easily outpacing the S&P 500’s gain of 6.2%. We had consistent performance across the board in Q1 with 8 of our 20 long positions delivering returns of 27% or greater. The portfolio seemed to go straight up from January 1st through mid-March before finally correcting in the final 10 days of the period. Since April 1st of 2020 the portfolio has jumped 132%.
Our best performer this quarter was Hovnanian, one of our Tier 1 holdings. The company’s stock price has been going up all year as the environment has been supportive for homebuilders. Hovnanian is generating significant free cash flow and has been able to refinance near term debt obligations. The stock doubled after reporting blow-out results for the first quarter. We sold the stock in the days after the Q1 earnings release for a substantial gain.
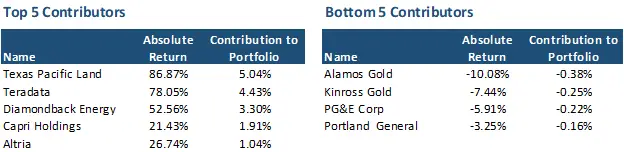
Like the Concentrated Value Portfolio, energy producers rounded out our top performers with Gran Tierra Energy (+92%) and Diamondback Energy (+53%). Rayonier Materials also had a strong showing due to higher pulp and wood prices. Village Farms once again landed on our list of top 5 contributors, and we had been trimming our stake between $14-$20 per share. The stock has subsequently fallen along with other cannabis stocks and we have recently added back to our position at $11 per share. Our original cost was just $4.
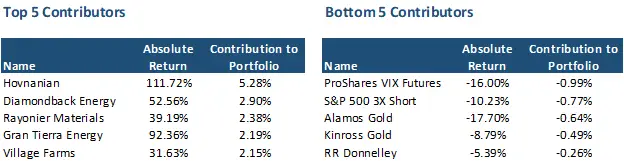
The bottom 5 contributors to performance this quarter were once again our hedges. Combined, our long VIX Futures and Short S&P contributed to a 1.75% drag this quarter. Additionally, our gold stocks underperformed, and we exited Alamos Gold as the company reached this portfolio’s limit-down criteria.
The portfolio was very active this quarter as we exited our positions in Endo Pharmaceuticals (a Tier 1 holding), Coty and Hovnanian on success. On the buy side, we initiated new positions in Arko Corp, RR Donnelley, and Landsea Homebuilders. For our investment case on Arko, please reference the Concentrated Value section above. Needless to say, Arko is a high-quality addition to the Phoenix Fund and one of the few overlapping names across our portfolios (Diamondback and PG&E Corp being the other two).
RR Donnelley (RRD) is a commercial printer that has struggled over the last 4 years as their traditional printing business consisting of manuals, publications and brochures have been in secular decline. The company was also burdened by an over-levered balance sheet that they inherited following the spin-off from their predecessor company in 2016. Shares fell from roughly $26 at the time of the spin-off to only $1 during the pandemic.
RRD has spent the last two years turning around their business. They have shed money-losing subsidiaries; sold off non-essential assets; lowered their debt levels to a manageable level of just 3.0x net debt/EBITDA; paid-off and refinanced their near and medium-term debt maturities (85% of debt is termed 2024 or later); and transitioned their operations towards growing end-markets such as packaging, labels, direct marketing, and digital print. Most of these changes have gone unnoticed by investors as every sell-side analyst dropped coverage of RRD and the covid pandemic disrupted their newer business units, especially packaging and marketing. As the crisis is slowly abating and economy recovering, it is now becoming clear that the new growth-oriented business lines are finally surpassing the legacy printing business and RRD should return to positive sales and earnings growth in 2021.
With their reconstructed balance sheet, we believe shares of RRD are extremely undervalued and poised to double or more. Our analysis suggests that RRD should be capable of producing normalized earnings power of approximately $0.60-$1.30 per share given their current business composition. Utilizing a 11-14x earnings valuation multiple, we estimate intrinsic value of RRD is between $7-18 per share. We acquired our position at $4.30 per share.
Landsea is a small-cap homebuilder with operations in California and Arizona that constructs entry level and move-up houses, town homes, and apartments. The builder came public via a SPAC in November and its shares have fallen below its $10 pre-deal SPAC price. Investors continue to ignore SPACs that didn’t merge with private companies in more popular industries such as electric vehicles, online betting, or rockets. This phenomenon has created real opportunities to purchase high quality companies at large discounts to our estimate of intrinsic value. Whole Earth Foods was the first of these SPAC-oriented investments that we made. Thus far, Whole Earth has performed nicely for us as investors ultimately learn more about these companies as they pickup analyst coverage and start to release financial results.
Our investment case on Landsea is based on continued strength in the housing market as there is a structural undersupply of homes that should support sustained new home construction for many years. We expect recent home price gains to persist in Sun Belt markets like Arizona and Southern California. Landsea is poised to benefit from these trends, especially in Arizona where they have made several smart acquisitions and have 75% of their unbuilt lots. As Landsea construction volumes increase and they potentially expand into Texas, we would expect to see revenue growth accelerate and an uplift in operating leverage versus their fixed costs.
Interestingly, shares of Landsea are trading at discount to other home builders even though they have lower leverage, higher growth potential, and exposure to strong markets. At $9.50 Landsea has a price to tangible book value of just 0.75x. This is a substantial discount to peers who trade for 1.2-1.4x tangible book value. We believe shares are worth $15-20, representing a favorable risk-adjusted return from our purchase price.
Finally, we wanted to revisit the investment philosophy of the Phoenix Fund. The portfolio takes advantage of structural biases against institutional ownership of financially levered companies with low-stock prices. We seek companies that have had their stock prices fall 70% or more in the last two years and are priced below $10 dollars per share. This outcome typically leads to forced selling from their institutional shareholders, creating the opportunity to make outstanding investments for less constrained investors.
Generally, these companies are under distress from poor performance caused by what we believe are temporary factors. These companies typically have elevated levels of debt, and any prolonged period of business stress could cause stockholders to endure substantial losses. The Phoenix Fund is a high-risk, high-return investment strategy. Please see the Risk of Loss Section of Part 2A of Form ADV referenced below.