To view this letter in PDF Format please click here: 2020-Q2 PBCM Investor Letter.pdf

Dear Investors;
We would like to begin this letter by thanking our emergency responders, healthcare professionals, and essential service employees who have continued to work tirelessly on all our behalves as they battle the COVID-19 pandemic. Just as importantly, we want to wish each of you and your families good health and high spirits. While there will certainly be continued sacrifices and trying times in the next several months, we believe the darkest days of this crisis have likely passed.
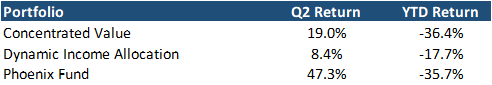
The changes we made in our portfolios that were discussed in our Q1 letter and implemented in March have resulted in immediate benefits. We have seen each portfolio return to operate as their mandates intended and how we would expect given the volatile environment, particularly the Dynamic Income Allocation Portfolio. The volatility and performance of each portfolio exceeded our expectations given the strong market performance. The performance was particularly strong when considering the concentrated Value and Phoenix portfolios had 28% and 22% respectively in cash during the quarter. The results for each portfolio for the second quarter and year-to-date are in the table below.
The layout of this quarter’s letter will start with a general market commentary, followed by individual reviews and analysis of each of our portfolios including Concentrated Value, Dynamic Income Allocation, and the Phoenix Fund.
As always, if after finishing this letter you have any questions or would like to discuss any topics in greater detail, please don’t hesitate to call 239-738-0384 or send an e-mail to tyler@pelicanbaycap.com. We welcome your feedback and look forward to your correspondence. Additionally, we encourage you to share this letter with as many friends and colleagues as you like.
Market Commentary
Several extraordinary events unfolded during the second quarter. Most of the developed world spent the months of April and May in a quarantine lockdown in an effort to slow the spread of the COVID-19 virus. Economist are estimating that GDP may have fallen by as much as 45% annualized in the period. The unemployment rate jumped to 16%, the highest level since the Great Depression. One out of every ten residential mortgages were placed in forbearance. Over 100,000 small businesses have closed permanently. Riots and looting broke out in city centers across our nation leading to extensive damage in some urban cores. Finally, and most amazing of all, US stock markets responded to these developments by going on a tear with the S&P delivering its best quarterly return since the 1980’s and the NASDAQ 100 reached a new record high.
Jeremey Grantham of GMO summed up this paradox well by saying, “The current P/E valuation on the U.S. market is in the top 10% of its history. The U.S. economy in contrast is in its worst 10%, perhaps even the worst 1%.”
While a bounce in asset prices was certainly anticipated following the steep collapse of values in March, the strength and length of the rebound has been breathtaking. Most surprisingly, there was never even a hint of a serious retest of market lows that are a normal feature of equity bear markets. As we will discuss in the Phases of the Crisis section below, markets have delivered all the triggers indicative of entering the Recovery Phase.
The S&P 500 has nearly retraced to its level at the start of the year, a period when the economy was accelerating out of the 2019 cyclical slowdown and the Corona Virus appeared isolated to a Chinese Province.
If we had been marooned on a secluded island for the last three months, and the only piece of information provided to us was the level of the S&P 500; we would presume that COVID had suddenly abated resulting in a dramatic V-shaped economic recovery. Unfortunately, this is not the outcome that transpired.
The probability of a V-shaped recovery developing is diminishing by the day. Sadly, we believe it is an extraordinarily unlikely outcome. We will not be returning to pre-COVID levels of economic activity anytime soon.
Remaining proponents of a V-shaped recovery are left to justify their position by extending the time frame for how long it will take for economic activity to return to normal. In March, the proposition of a V-shaped recovery required economic activity to return to pre-COVID levels by this summer. If you recall, the nationwide quarantine was intended to quickly eliminate the virus by not allowing it to spread further as we all stayed home. The idea was that we could simply shut down the economy for a few weeks in some form of suspended animation. This is precisely why the stimulus measures enacted by the Cares Act mostly expired in June and July.
It is July now and unfortunately there is no return to normalcy in sight. The virus continues to spread and discourage economic activity. Unemployment levels remain elevated and we still believe the over/under on the December jobless rate is around 10%; a far cry from the sub-4% readings we enjoyed last year. We think the economy could be at approximately 90% of pre-virus levels through the second half of the year. This is a large rebound from the low in Q2 during the peak of business closures, but a 10% economic contraction would be devastating. To put this gap in perspective, during the Great Financial Crisis of 2008, economic activity fell to 96% of its pre-recession level, only a 4% decline.
We think there has been enough economic damage done to small businesses and consumer psychology that even if a miracle treatment or effective vaccine were discovered today, the level of unemployment and economic activity would fall short of prior levels for at least another 1-2 years. We agree with Mr. Grantham, that the magnitude of the recovery in the S&P 500’s valuation is difficult to justify by realistic expectations for near term economic output.
Mr. Grantham has not been alone in his disdain of the strength of this rally. One of the biggest contradictions of this recovery rally is that many prominent investors and strategists have stridently expressed concern about the elevated valuation multiples of the S&P 500 Index. Yet these same investors are piling into the FAANG stocks and issuing “strong buy” recommendations without even a hint of concern that these stocks individually have super rich valuation multiples. Yet it is precisely these very FAANG stocks that are mostly contributing to the whole market’s rich valuations multiple.
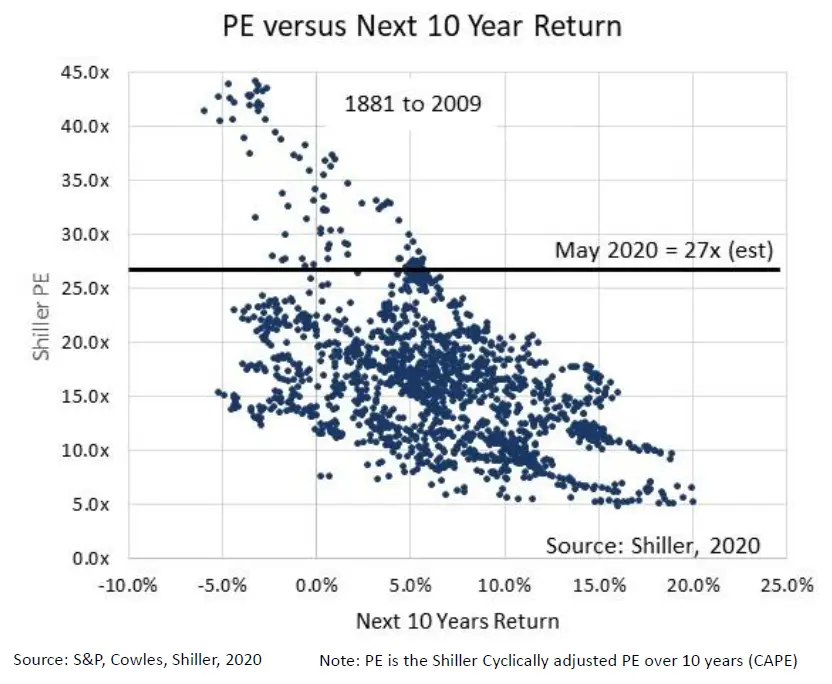
Moreover, long-term investors should not be cheering this sharp rebound. The link between current valuation levels and total market returns over the following decade does not bode well for investors. As of May, the S&P 500 reflected a cyclically adjusted P/E ratio of 27x. We suspect this valuation ratio moved even higher in June. In every trailing 10-year period where this ratio met or exceeded that level, the total return over the next 10 years was less than 5.5% annually and often below 0%.
The chart on the following page shows the 10-year annual returns corresponding to the beginning of the period’s valuation multiple. Each dot above the line represents a starting point where the multiple was similarly 27x or greater.
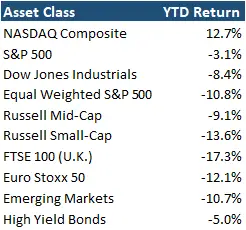
However, this doesn’t mean investors are doomed to suffer inferior returns. The enthusiasm captured in the market’s rebound and elevated P/E ratio is primarily confined to the largest mega-cap tech stocks that have an oversized influence on the most popular indices such as the S&P 500 and NASDAQ 100. A quick look beyond these headline indices shows asset values that are still significantly down since the beginning of the year. The table below is year-to-date returns for a handful of asset classes.
We continue to see value and decent long-run returns in small cap stocks, value stocks, and international stocks. For long-term investors diversification is more important then ever. While large cap tech stocks have justifiably been the standout performer over the last decade, they currently appear to be pricing in a lot of optimism. It will be exceedingly difficult for large cap tech stocks to replicate their strong performance over the next several years. We are not suggesting the current outperformance won’t continue in the near term. Valuations can get much pricier as we saw in the tech bubble in the late 1990’s or the “nifty fifty” stocks in the late 1960’s. However, the law of large numbers is ultimately a worthy adversary.
Update on Phases of the Crisis
Please note that this portion of the market commentary section is a continuation of our discussion from the COVID-19 Update Letter that we published on March 17th and our First Quarter Letter published on April 15th. Both documents can be downloaded from the Investment Commentary section on our website at www.pelicanbaycap.com.
Through our studies of historical financial panics and recessionary environments, we believe that these periods of market distress can be distilled into three phases with unique and defining characteristics. These three phases are: Panic, Acceptance, and Recovery.
Below is the analog chart from the 2008 financial crisis that we use as a helpful tool to define these three phases for our readers. On the chart below is the S&P 500 in white (left axis) and the price of gold in yellow (right axis).

In our last letter, we noted that the market had transitioned from the Panic Phase to the Acceptance Phase in April, and we provided a list of indicators to confirm the move into the Recovery Phase. Some of the market indicators we were tracking for verification that the stock market had begun the Recovery Phase were:
- There is a month-long period where stocks widely outperform gold prices.
- Increasing trading volumes on the S&P 500 Index
- The VIX falls back to 30 or lower.
- High yield credit spreads vs. treasuries fall below 6%.
As of July 1st, we observed each of these signals. Amazingly, it appears we have entered the Recovery Phase of the market and have started a new bull market in equities. The normal volatility associated with the Acceptance Phase never materialized in this bear market.
We believe the unprecedented monetary support provided by the Federal Reserve led to the sharp rebound in risk assets. Their aggressive actions confirmed the existence of the “Fed Put” giving investors the green light to pile into riskier assets in a reach for yield or higher returns. The $3 trillion of liquidity they provided to the treasury and mortgage backed securities markets quickly found its way into equities. Of course, this is exactly what the Fed was trying to do. The debate as to whether they are creating a moral hazard is irrelevant. They wanted to stabilize markets that were in free fall during the Panic Phase and that is all that should matter for investors. Their influence on assets values was much more powerful than we anticipated.
Considerations for the Medium-Term Economic Outlook
As we currently find ourselves in the clutches of a deep and unexpected recession, a considerable amount of attention is being given to the immediate and near-term economic impacts of the COVID-19 pandemic, and rightfully so. It is almost impossible to get through the Wall Street Journal or a segment on CNBC without some economist or investor suggesting the appropriate letter of the alphabet applicable to the path of recovery from our current predicament.
The unsettling truth is that the range of potential outcomes for the trajectory of the economy over the next two years is extraordinarily wide. Moreover, applying realistic probabilities to these scenarios is difficult given the extreme levels of uncertainty currently present. For example, we still don’t understand many critical features of the virus including: how it really spreads, why some are asymptomatic, will it be seasonal, or does infection result in immunity. We don’t know how many job furloughs will become permanent, how many businesses decide not to reopen, or if bipartisan rescue measures can muster indefinite support if the virus lingers. In the short-term, the best course of immediate action for decision makers is to prepare for the worst and hope for the best.
Nevertheless, we are optimistic that a vaccine is ultimately discovered, and the economic system returns to a period of normalcy over several years. We believe it is a much more useful exercise to formulate educated guesses about the long-term rather than short-term economic implications of the virus. There is simply too many unknowable outcomes that could make short-term implications more challenging to forecast. Contemplating these potential trends now should give investors a better opportunity to prepare for the future as the next economic expansion gets under way.
Let’s start with the bad news and discuss some likely developments that should be concerning for investors. The two big trends are higher taxes and lower economic growth potential.
Taxes applicable to corporations are likely to increase. This includes Federal-level corporate taxes, individual taxes applicable to dividends and capital gains, and State-level corporate taxes. When the government protects businesses on the downside, they have the right to ask for higher taxes from the upside. Additionally, periods of economic calamities usually result in an electorate more amenable to tax increases, especially on corporations and the wealthy.
Moreover, the government is fighting this pandemic as if we were mobilizing for war. Historically, wartime funding has not been good for the wealthy. The first income tax was imposed during the Civil War, and the top tax rates jumped to 77% and 94% during World War I & II, respectively.
Prudence would suggest that investors should incorporate higher future tax rates into their financial modeling. Expect punitive rates more quickly if Biden wins (he has already proposed a hike in corporate taxes to 28% from 20%, which by itself would lower corporate earnings by 10%), and even moderate increases if Trump wins.
US government deficits will cut economic growth potential to 1.0-1.5%. Debt is growing much more rapidly than the economy and thus more of our national income will have to be devoted to debt service. This results in lower consumption and capital investment that combine to create a reduction in the country’s economic growth potential. Just to be clear, we are not contemplating any impact of deficits on higher interest rates, just economic growth, or GDP.
There is ample economic research to suggest that higher budget deficits lead to lower GDP growth. We saw this impact in the United Kingdom in the 1950’s and Japan in the 2000’s. As the US deficit jumped to 60 and 70% of GDP in the last 10 years, the US output potential corresponded by shrinking from 3-4% down to 2-2.5%. Now we are closing in on 100% of GDP. In other developed countries where deficits approach 100% of GDP, the economic growth potential has typically declined closer to 1%.
Other potential considerations include:
- Increased nationalization leading to lower levels of international trade, higher tariffs, and a shift of production capacity closer to the end-user. This will likely result in a shift in manufacturing to regions with higher-cost labor. In absence of corresponding price increases, profits will be under pressure.
- Businesses will incur substantial compliance costs in a post-virus world. We are likely to see added regulations from local officials regarding worker sanitation and hygiene. In the first years of recovery some industries involving close contact will struggle.
- Individuals and companies will need to clean up balance sheets,and personal consumption and business-to-business spending will be under pressure. It is not unusual for personal savings rates to increase by 3-5% following recessions. Remember, one person’s savings is another person’s lost revenues. Companies will also likely shore up balance sheets faster by selling assets, raising equity, and reducing share buybacks.
- Potential jump in longevity. Not every outcome from the pandemic is bad news. The boost of R&D spending in search of treatments for COVID has reopened the debate on Stem Cell technology that had been made off limits under the last Bush Administration. Stem cells and their lab-made cousins called exosomes, are showing amazing healing properties when delivered in experimental therapies. They are showing signs of reversing cancers and other diseases associated with aging. An increasing use of full body-MRI scans for early detection of cancers and heart disease are also pushing into the mainstream. Lastly, we will likely exit this period with an increasing emphasis on health and wellness. The combination could result in adding 5-10 years to our life expectancy. If 30-50% of these added years are given back to the work force, it would be the equivalent of adding 20-30 million immigrants to the labor force and could lift potential GDP growth by an incremental 1% annually.
Concentrated Value
The concentrated value portfolio performed very well in the quarter generating a total return of 19.0%. We were able to outperform the Russell Large Cap Value Index and our large cap value mutual fund peers who each returned 12% and 16% respectively. Importantly, we achieved our results with much lower risk as the portfolio held an average cash position representing 28% of our holdings.
The current size of our cash position is significantly higher than the 1-7% range we normally hold. We typically use our cash balances as a source and use of funds as part of our process of maintaining our portfolio that typically comprises 19-20 names (as a reminder our mandate limits our holdings to no more than 20 companies). Conversely, the elevated cash we have today is a deliberate decision as our expectations for increased volatility in the next several months should present some compelling entry points for the companies on our target list to buy.
To be clear we aren’t trying to time the market. We are still applying bottom-up fundamental analysis on each of our investment ideas. However, when we look through the market for new investments, we see valuations for high quality companies that rebounded too fast and now appear pricey. In fact, we have already had to trim some of our current holdings (Moody’s and Kinross Gold) as they quickly bounced to new highs. We even exited Gilead on success as the company jumped on the announcement that their COVID-19 treatment was partially effective.
Alternatively, we are closely following several companies that were materially impacted by social-distancing initiatives. Their stock prices would likely decline further if a severe second wave of COVID materializes and major economies reverse the reopening process. As we write this letter, the probability of a second wave rolling back our process of reopening the economy is increasing.
In either case, we are prepared to pounce. Do not be surprised to see cash levels much lower when we publish our 3rd quarter letter in October.
Below is a table of our top and bottom five contributors to the portfolio return for this quarter. There were no obvious trends to explain the results, as we saw success across our various groupings of stocks.

Most of our stocks generated positive returns with the exception of Nutrient and Berkshire Hathaway (Liberty Braves was acquired just a few days before the end of the quarter). Investors shied away from Mr. Buffett’s conglomerate as he similarly chose to let his substantial cash balances grow further as he held off making any new investments. The price of Berkshire is very compelling, and we are confident Mr. Buffett will find new investments and deploy his cash hoard. We are not in the camp that he has lost his touch.
Towards the end of the quarter we built a position in the Liberty Braves. The company owns the Atlanta Braves Major League Baseball (MLB) team. The company also owns the Stadium where the Braves play as well as surrounding residential, retail, and commercial real estate. The company is publicly traded subsidiary of John Malone’s Liberty Media Group. The share price of the Braves was materially impacted by the pandemic as professional sports stadiums remain empty for this summer and possibly next. The stock fell sharply during the initial market panic in March. After-rebounding, the stock has pulled back again giving us an opportunity to initiate a position at approximately $20. The company was on our watch list of companies that were most impacted in the short-run from the pandemic.
We believe the Braves are worth $30-$40 per share as the demand for professional sports and trophy assets will persevere after the crisis subsides. If anything, we believe the value of broadcast rights to live sports have proven their worth during the pandemic as network viewership has fallen dramatically without games being played. The Forbes estimate of the Braves franchise value is $1.8 billion or approximately $34 per share. Historically profession sports franchise transactions have generally occurred above the valuation estimates provided by Forbes
Early in April we added Abbott Labs to the portfolio. Abbott is in the Healthcare Diagnostics, Medical Device and Consumer Health sectors. The consumer health unit manufactures nutritional products for infants and adults and has been growing steadily as part of the Wellness Economy. The company will benefit from COVID-19 as they are the leader in making tests for the virus and antibodies. We believe testing will be the largest beneficiary of the healthcare response to the virus as individuals will require frequent testing to reopen. Additionally the low price point for a single test will not attract pushback in the media, allowing Abbott to earn a substantial profit on the tests.
Conversely, we don’t believe COVID treatments or vaccines will be allowed to set a price where they make substantial profits. This is one reason we sold our stake in Gilead as we did not believe they would be able to put a high price on their COVID treatment, as doing so would create a public outcry. None the less, the stock jumped considerably on the announcement of their partially successful drug trials and we sold into strength. After divesting the stock, Gilead provided pricing details that confirmed they won’t make much of a profit on the Remdesvir treatments.
In addition to significant growth from their leading medical testing franchise, Abbott Labs has a healthy pipeline of innovative wearable medical devices that are awaiting FDA approvals. The company has a clean balance sheet, consistently generates returns on equity of almost 20%, and currently pays a 1.6% dividend yield. Each of their end-markets is poised to grow faster than the overall healthcare industry and will result in substantial earnings growth over the coming years. We believe Abbott’s shares are worth $100-$130.
Lastly, we wanted to revisit the Investment Philosophy of the Concentrated Value Portfolio. We utilize a value investment strategy that seeks out companies for investment which the Portfolio Manager deems to be high quality companies. Quality is defined by possessing business operations with durable competitive advantages, allowing for high returns and growing cash flows streams. We want these high-quality companies to also have solid balance sheets, preferably with a net cash position. We also prefer that their management teams make decisions with an emphasis on maximizing shareholder returns.
Once we find these high-quality companies, we generally only invest in their stock if they trade at a steep discount to our estimate of their intrinsic value. This is necessary to provide our investors the opportunity to generate an above market return and protect capital. This discipline creates a wide margin of safety if an undesirable scenario plays out in the future. Pelican Bay Capital Management believes that identifying a significant difference between the daily market value of a security and the intrinsic value of that security is what defines an investment opportunity.
Dynamic Income Allocation
We were very pleased with the performance of the Dynamic Income Allocation Portfolio (DIAP) in the second quarter. The portfolio steadily climbed through the quarter and generated an 8.4% return. Approximately 1.2% of the quarterly return came from dividends. The remainder of the return came from capital gains associated with a broad increase in asset values during the quarter. The portfolio’s volatility declined substantially from the first quarter as we put more defensive measures in place and added new position sizing limits. The average daily price move was just 0.13%, or approximately a third of the daily volatility of the S&P 500.
Throughout the quarter we maintained our portfolio in the “Max Protect” position with only a 30% exposure to equities. We were hoping for the market to retrace at some point in the quarter where we would be able to transition the portfolio to a more aggressive posture, but this scenario hasn’t unfolded as of yet. We believe the probability of an opportunity presenting itself in the third quarter is high, as the benefits from the Fed’s large liquidity injections in March, April and May fade and the values of riskier assets retrench. In the near term we are making no changes to existing target allocations.
Importantly, even though we have lowered the portfolio’s risk profile last march and we saw good performance in the second quarter, there is still substantial upside return potential to our current asset classes as value-oriented equities remain well below their pre-COVID levels and corporate bond spreads continue to be elevated. We would not be surprised to see our holdings outperform the S&P 500 in the near-term as valuations surrounding growth equities are reaching frothy levels and value appears poised for a catch-up. In particular, we have been surprised that bond proxies like utilities (VPU) were essentially flat in the quarter despite pledges from the Federal Reserves to keep interest rates low for the next several years.

When we feel it is appropriate to shift the DIAP to a more aggressive posture and move away from our “Max Protect” positioning, our investors can expect to see us divest our mortgage back securities position (MBB) first. We will also likely trim our intermediate corporate bond position. We will increase our allocation into high dividend US (VYM) and International (EFAV) stocks. We may also initiate new positions in REITS or Mortgage REITS if the discounts for these asset classes remain wide.
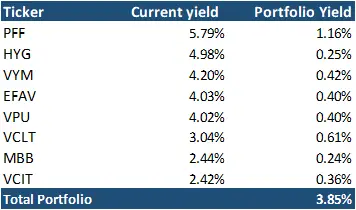
As valuations increased and interest rates on newer corporate bonds fell, we have seen the current yield on the DIAP fall marginally to 3.9% from 4.2% last quarter. We do not expect the yield to decline much further, and as we eventually adjust to a more aggressive posture, we will see this yield increase further. The existing dividend yield still represents a substantial premium to US treasuries which are currently yielding 0.7%, representing a 3.2% spread.
Lastly, it is important to reiterate the investment philosophy of the Dynamic Income Allocation Portfolio. The DIAP is designed to function as the core foundation of an investor’s portfolio by operating with the dual mandate of generating the highest current income possible while preserving capital.
Pelican Bay Capital Management attempts to achieve this dual mandate by only investing in asset classes that by themselves offer a current dividend yield that is greater than either the dividend yield of the S&P 500 or 10-year U.S. Treasury. In our view, elevated income can add stability to a portfolio and maximize the benefits of compounding through reinvestment.
We then construct a portfolio of these high-yielding asset classes with an emphasis on minimizing correlation of the overall portfolio and maximizing its diversification beyond the typical 60/40 stock/bond portfolio. We finally add a valuation overlay that we utilize across all our portfolios. We allocate a larger position weighting to the most undervalued and attractive investment opportunities, while avoiding owning overpriced assets.
Phoenix Fund
Please note: The Phoenix Portfolio is only available to “Qualified Clients” pursuant to section 205(e) of the Investment Advisors Act of 1940 and section 418 of the Dodd-Frank Act.
As we discussed in our first quarter letter, the distressed company stocks that make up our investable universe for the Phoenix Fund had sold off significantly in the first quarter as investors unloaded riskier assets in a panic. The selloff in our names was vastly overdone. Also, new opportunities arose in higher-quality companies that also dramatically fell. The combination led to strong results in the second quarter. The opportunity to invest in distressed assets are most favorable where there is times of market panic and this spring was no exception. At one point in early April, cash had fallen to just 6% before increasing later in the quarter as we reduced risk in the face of strong gains and rising economic uncertainty.
The portfolio returned an exceptional 47.3% in the second quarter and was up 65% from its low in the last week of March. Our newly added positions contributed towards 12.4% of the return this quarter led by strong gains from Nordic American Tankers (93% absolute return), Kinross Gold (81%), Capri Holdings (68%), and Oaktree Specialty (53%). We have already sold many of these positions on quick success with the exception of Kinross Gold where we added into strength as there is still significant upside, even if the market’s risk appetite deteriorates.
Two of our Tier 1 holdings produced sharp rebounds and were responsible for nearly half of our quarterly gain representing a combined contribution to the portfolio of more than 20%. We trimmed our positions in ADT and Hovnanian as they each grew to a 15% position in the portfolio. We still expect further gains from both companies. However, from a risk management perspective we needed to shrink our positions to a more appropriate size. Both names remain in our Tier 1 bucket along with Kinross Gold, Asure Software and Francescas.
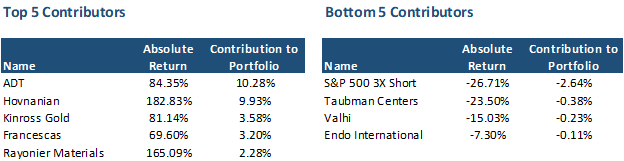
There were few detractors to our performance in the quarter with our losers contributing to a 3% drag on our performance. Most of these losses came from our hedging initiatives. From time to time early in the quarter we shorted the S&P 500 after big spikes. We believed it was a reasonable possibility that markets could retest lows as they commonly do in bear markets, and we wanted to protect the portfolio if market sentiment deteriorated.
We also had a small loss in our trading bucket as Simon Property Group sued to abandon their merger of Taubman Centers, a competing Shopping Mall Operator. This is the first time we have lost money in a merger arbitrage opportunity. Taubman was trading at a 25% discount to its agreed all cash merger offer of $52 per share from Simon.
Our thesis was that Simon would complete the deal as they have coveted Taubman’s 25 malls for several years. At the same time, Simon was already buying Taubman at a deep discount to its historical valuation and had more than adequate liquidity to fund this deal and manage the COVID crisis. Additionally, as Taubman’s portfolio consist solely of successful “A-rated” malls, if Simon walked it would imply their own market value was overvalued, resulting in a falling share price. Ultimately, our analysis of the situation turned out to be false and Simon announced they were scuttling the deal. Our losses were limited by appropriate sizing of positions in our trading bucket.
We built a new position in Invesco early in April. Invesco is a large Asset Management player that has struggled to grow over the last few years as investors shift assets away from actively managed mutual funds. Invesco has a respectable ETF offering but the growth of this business has not been able to offset the persistent decline in the mutual fund space. Its share price has been declining for several years and the company already traded at just a 9x earnings multiple before the pandemic hit. Shares fell from $18 dollars at the beginning of the year (and as high as $36 in 2018) to a new all-time low of just $7 in April where we pounced on the name.
Invesco’s shares were fetching just 4x forward earnings when we bought the stock. A price so low is usually a signal that a company is about to go broke, but Invesco’s business is expected to generate consistent profits well into the future with no bankruptcy in sight.
Investors were clearly liquidating the stock in frustration, and we stepped up to take advantage. Normally we don’t get an opportunity to buy such a high-quality company in the Phoenix Fund. Opportunities like this are one of the few silver linings of this pandemic.
Another new position we entered was New Residential Investment (NRZ). This company is in the mortgage servicing and origination business. Part of the mortgage servicing business is making cash advances of anticipated mortgage payments from homeowners that are due to the holders of the corresponding mortgage backed securities. Payments sometimes come in late or move into arrears. NRZ must front these payments for as many as 4 months before they are reimbursed by the MBS owners.
When COVID struck legislation was passed allowing mortgage payment holidays and forbearance for homeowners. There was a legitimate worry that NRZ would have to front more cash than they had in available liquidity. In just a few short days, investors fearing the worst, drove the stock from $18 to below $4. Our analysis showed that NRZ would have the capacity to weather the storm and their financial release showed that their book value had fallen from $16 to $11 per share, and they were able to secure ample financing to meet any extraordinary challenges posed by the payment advance business. We acquired our shares for $5.84 and saw a quick rebound to $8.00 where we sold down most of our position on success. We anticipate we may get another crack at owning NRZ in the near future as any worries about a second wave of the virus and reversal of openings could cause investors to sour on the name again.
Finally, we wanted to revisit the investment philosophy of the Phoenix Fund. The portfolio takes advantage of structural biases against institutional ownership of financially levered companies with low-stock prices. We seek companies that have had their stock prices fall 70% or more in the last two years and are priced below $10 dollars per share. This outcome typically leads to forced selling from their institutional shareholders, creating the opportunity to make outstanding investments for less constrained investors.
Generally, these companies are under distress from poor performance caused by what we believe are temporary factors. These companies typically have elevated levels of debt, and any prolonged period of business stress could cause stockholders to endure substantial losses. The Phoenix Fund is a high-risk, high-return investment strategy. Please see the Risk of Loss Section of Part 2A of Form ADV referenced below.
On the operational front, Pelican Bay Capital Management has brought on Cameron Galbraith as Equity Research Intern for the Summer of 2020. Cameron is currently a Junior at the University of Florida in Gainesville, FL pursuing a major in Finance. This summer, Cameron will be tasked with researching publicly traded companies in the retail industry for potential investment.