2020 First Quarter Investor Letter
To view this letter in PDF Format please click here: 2020-Q1 PBCM Investor Letter.pdf

Dear Investors;
We would like to begin this letter by acknowledging and thanking our emergency responders and healthcare professionals who have risen to meet the challenge presented by the greatest healthcare crisis of our lifetimes. Their courage, grit, and self-sacrifice to put themselves in harm’s way is truly admirable and is an inspiration for all of us.
We would also like to wish each of you and your families good health, and we hope that you stay safe and in good spirits during this trying time. This pandemic has reminded all of us how little control we actually have over most aspects of our day to day lives. For many of us, this can create strong feelings of uneasiness and despair. With that being said, there is one thing that each and every one of us has absolute control of – our attitude. It is important that we remember and remind others that the key to happiness and success is within your own hands. That key is to maintain a positive attitude.
Our society has thus far risen to meet the challenge posed by this virus. The Federal Reserve rapidly stabilized the financial system. The Government has abandoned their partisan differences to help offset the economic difficulties impacting our most vulnerable citizens and small businesses. Millions of our neighbors and ordinary citizens are volunteering their time and making donations to help those in need. The best and brightest from our Pharmaceutical and Technology industries are racing to find an effective treatment. At Pelican Bay Capital Management, we think betting against American ingenuity and resolve in the face of a crisis is a fool’s wager.
It is extraordinarily likely that in the next 24 months there will be an effective vaccine for COVID-19. A treatment could be found even sooner. This dark time in our history, like those before it, will ultimately come to an end. Better days are ahead.
The financial markets were extremely challenging in the month of March. The stock market endured its steepest decline on record for such a short period of time, experiencing a fall from peak to trough of 34%. Panic selling and an evaporation of liquidity in credit markets resulted in normally safe investments like bonds and gold plunging by 11% and 13% respectively.
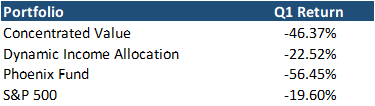
As you can see in the table below, our portfolios performance was less than satisfactory. While we would expect the Phoenix Fund to underperform in a period of tremendous market distress, the weakness experienced in the Concentrated Value and Dynamic Income Allocation portfolios was not in line with our expectations and out of step with their prior strong performance in earlier periods of negative markets.
To say that we are disappointed in these results would be an understatement. As we discussed in our COVID-19 update that we published on March 17th (this note can be found on our website); the swift downturn in markets exposed some weaknesses in our portfolio construction that we were not aware of. As Warren Buffett frequently expounds; “Only when the tide goes out do you discover who's been swimming naked." The simultaneous appearance of two black swan events (the Global Pandemic and Oil Price War) made us realize that unbeknownst to us our swim trunks were skimpier than we thought.
We have moved decisively to shore up these shortcomings exposed by this crisis. As we will discuss in much more detail below, we have made all the necessary improvements in our portfolio construction to improve these blind spots. We are confident that these adjustments will result in more robust portfolios that will better weather future bouts of poor markets and more importantly take advantage of the many opportunities that are now in front of us. We are already seeing results in line with our expectations since making these adjustments.
Two of the foundations to investment success are continual learning and honest self-reflection. This includes learning from mistakes and taking swift action to correct them. We believe it is critical to seek disconfirming evidence in both our individual investments and views on overall portfolio construction. At Pelican Bay Capital Management, we exercise these fundamentals and when the facts change, we change. We will continue to focus on the long-term and providing superior risk-adjusted returns for our investors.
The layout of this quarter’s letter will start with a general market commentary, followed by individual reviews and analysis of each of our portfolios including Concentrated Value, Dynamic Income Allocation, and the Phoenix Fund.
As always, if after finishing this letter you have any questions or would like to discuss any topics in greater detail, please don’t hesitate to call us at 239-738-0384 or send us an e-mail at tyler@pelicanbaycap.com. We welcome your feedback and look forward to your correspondence. Additionally, we encourage you to share our letter with as many friends and colleagues as you like.
Market Commentary
Given the severe impacts of the COVID-19 Pandemic and the elevated uncertainty surrounding the economy and financial markets, our market commentary section will be more in-depth than prior letters.
Update on Phases of the Crisis
Please note that this portion of the market commentary section is a continuation of our discussion from the COVID-19 Update Letter that we published on March 17th and can be downloaded from the Investment Commentary section on our website.
Through our studies of historical financial panics and recessionary environments, we believe that these periods of market distress can be distilled into three phases with unique and defining characteristics. These three phases are: Panic, Acceptance, and Recovery.
Below is the analog chart from the 2008 financial crisis that we use as a helpful tool to define these three phases for our readers. On the chart below is the S&P 500 in white (left axis) and the price of gold in yellow (right axis).

The stock market losses in March were swift, painful and all too typical for the Panic Phase of a market crisis. As we entered April, the culmination of the following events ultimately calmed markets: aggressive steps taken by the Federal Reserve to inject liquidity into all corners of the financial system; Congress’s fast action on providing a fiscal stimulus package; and the halt to the unwinding of excess leverage at macro hedge funds and commodity trading advisors. We have seen enough evidence to give us confidence that the markets have exited the Panic Phase and transitioned to the Acceptance Phase.
In the last 2 weeks we have observed several signals indicating that markets have moved on to the Acceptance Phase of a financial panic:
- The VIX index has fallen in half from its peak of 82 to 41.
- Gold, after falling in the rush for liquidity, has increased to new highs above $1,700 per ounce, representing levels we haven’t seen since the last financial crisis.
- The S&P 500 has managed to generate its first bear market rally, bouncing 24% off the bottom that occurred on March 20th.
- Corporate bond spreads have begun tightening with high-yield junk spreads falling under 8% after spiking as high as 11% over similar dated US Treasuries.

To be clear, the Acceptance Phase is not an unconstrained green light for investors to rush back into risk assets, nor does it imply that we have seen the bottom for this bear market. Looking back to all the market panics and recessions since 1929, the ultimate stock market bottom occurred in the Acceptance Phase, not during the initial plunge of the Panic Phase.
We would not be surprised if the stock market retested the recent lows or even went lower. We believe the current 24% rebound in the S&P 500 has all the hallmarks of a bear market rally that are common in the Acceptance Phase. What usually happens in a bear market rally is that the rally lasts long enough to convince everyone it is real. Market pundits start to proclaim that the bottom is in, and it can only go up from here. Investors begin to worry they missed it. Bear market rallies of 20 or even 25% are not uncommon.
For example, lets revisit the 2008 Financial Crisis again. Below is a chart of the S&P 500 from September 2008 through March 2009. This time period depicts the Panic Phase and Acceptance Phase of that recession. You can see that after the market collapsed by 34% during the Panic Phase, stocks went on to produce two strong bear market rallies (+18% and +24%) during the Acceptance Phase before ultimately finding a bottom in March of 2009.

The key message for investors is that they should expect heightened volatility in the coming months and that calling the bottom as it unfolds is next to impossible. The bottom may occur before there are enough actionable signs that we have moved into the Recovery Phase. Only then will the market enter a new prolonged bull market.
These are some of the market indicators we are watching for to provide verification that the stock market has begun the Recovery Phase:
- There is a month-long period where stocks widely outperform gold prices.
- The VIX falls back to 30 or lower.
- High yield credit spreads vs. treasuries fall below 6%.
In the interim, investors should consider deploying their capital in small tranches each time market sentiment turns negative and stock prices decline. We will be methodically adding to stocks and high-yield securities whenever stocks fall by 5% or more.
We believe it would be pre-mature to shift to a full risk-on stance unless either of two events occur. First, it is clear to us that the markets have transitioned to the Recovery Phase. Second, the market falls to a level where the medium-term outlook for strong investment returns are so attractive, we would be willing to accept further additional losses in the short-term to buy at that level. At Pelican Bay Capital Management, we think this point is approximately 2,000 on the S&P 500. We believe this represents a very attractive discount to the S&P 500’s intrinsic value in a post-COVID 19 world when the global economy recovers.
Post COVID-19 Market Valuation
There is a lot of speculation on how fast the economy and stocks will recover. Many commentators are linking an alphabet letter to the current crisis with the majority of guesses centered on V, U, L, and W shaped recoveries. If we were forced to participate, we would probably go with a square root symbol in reverse (√). This symbol represents a sharp downturn followed by a new level of economic activity that is lower than where we stated before the crisis.
Unfortunately, utilizing these symbols leaves a lot to be desired, such as timeframe and severity.
We think trying to model the near-term impacts of the virus is nearly impossible and may prove a fruitless exercise as investors will likely ignore the near-term economic carnage and try to look past the virus for greener pastures. This in no way belittles the current economic destruction we are seeing, or the real pain associated with each job lost and bankruptcy petition filed. But the virus will ultimately run its course as the medical community finds a treatment in the coming months or at worst case, a vaccine by next year.
We have created a framework for making an informed guess of the intrinsic value of the S&P in a post COVID-19 environment. This requires us to forecast a range for both: (a) S&P 500 Earnings per share, and (b) the market multiple that investors will apply to these earnings.
The most challenging part is building a realistic range for earnings per share for the S&P 500. This is because many industries and profit margins will not snap back to their pre-virus levels, even in a full recovery. Our starting point is the 2018 and 2019 S&P 500 earnings per share which was approximately $163 per share for both years. During this period, the Net Profit Margins for the S&P 500 were 12%, which was at an all-time high.
We would expect these profit margins to be lower after the virus fades away, settling around 10-11%. Firstly, given the disruption to supply chains, there may be a move away from just-in-time inventory management that will result in companies carrying higher levels of inventory that will ultimately come at an added cost. Secondly, we think it is likely that approximately a quarter to a third of total manufacturing will be moved closer to their end markets. This will result in a reversal of the trend to outsource manufacturing capacity to the regions with the lowest labor costs. Thirdly, consumers will likely be more cautious and will increase their savings rate to either replenish savings spent during the economic lockdown and/or build a bigger cushion for the future. We saw this after the Depression and Global Financial Crisis as deep recessions tend to result in elevated levels of consumer frugality in the medium term.
The lower profit margins would reset the S&P 500’s earnings per share to between $136 and $149 after the economy is reopened, and activity returns to some normality. Earnings likely fall much lower than this in 2020 with the economy shut down, but that would be a temporary decline and the markets will ignore it. If we assume earnings growth returns to 7-9% in the recovery stage, then one year forward earnings per share would be $145 to $162.
The second part of the forecast is applying an appropriate market multiple to this forward earning forecast. In our opinion, the 2012-2015 time period following the Global Financial Crisis is the best proxy for an environment that aligns closest with our expectations for a post-virus recovery. During this period, interest rates were very low and economic activity had returned to its long-run growth potential. Between 2012 and 2015 investors applied a 15x-18x multiple to their estimates for S&P 500 earnings per share. If we use a similar range for our post-virus recovery world and apply it to our estimate of $145-$165, then the fair value of the S&P 500 would be a range of 2,175-2,916.
As we write this letter, the S&P 500 is currently 2,840, just shy of the upper end of our best guess at a post-virus S&P valuation range. This indicates to us that either: (a) the trillions of liquidity being pumped into the markets by the Fed and Congress (as much as 7 trillion at last count) is obfuscating the fundamentals, or (b) market participants expect a “V” shaped recovery where every business reopens to pre-virus demand, profit margins bounce back to peak levels, and the equity risk premium shrinks back to its recent low levels. We concede that the liquidity injection in option “A” is a plausible explanation. However, the “V” shaped recovery seems very unlikely in our opinion forgoing the announcement of a miracle treatment in the next few weeks. The remaining possibility is that stocks have rebounded on low trading volumes in a classic bear market rally, and the prudent course of action in the near-term is to remain cautious and wait for better prices to deploy more capital.
Oil Market Update
Forgive us if you’ve heard this joke before: a strongman dictator with an obsession for playing the spoiler, and a rash young prince with the world’s biggest trust fund, walk into a bar in Vienna...
The oil market is in extreme duress. With one third of global population in lockdown, daily demand for crude oil has fallen by 25-35 million barrels per day. For reference global demand at the end of 2019 was approximately 100 million barrels per day. This decline is unprecedented in the history of the oil age. There are no superlatives that accurately describe the magnitude of such a move.
The ultimate result is that the entire global inventory capacity to store oil will be completely filled up in the next several weeks. This has never happened before. At that point, the oil market will become dysfunctional as pipelines close and producers are forcing to shut-in wells. It is not inconceivable in this environment that benchmark oil prices like WTI and Brent fall below $10.
No amount of supply cuts from OPEC or their partners can stop this from occurring. In fact, we think OPEC wants this to happen as they believe it will finally destroy the US shale industry. Last week, through strong cajoling from President Trump, OPEC and its partners were only able to reach an agreement to cut output by 9.7 million barrels per day. This is clearly not enough to fill a 25 million plus barrel per day demand gap. Even worse, the cuts won’t be applied by OPEC until May 1st, so Saudi Arabia, Iraq, Russia and Kuwait will continue to pump at elevated levels till then. May is still 3 weeks away and by then global oil inventory facilities could have already reached their maximum limit.
Oil supply will ultimately fall as new projects are halted as they are all uneconomic at current prices. With no new wells to replace existing production, decline rates will take hold with conventional oil fields seeing 3-12% natural decline rates. Even worse, US shale wells having sharper declines as high as 40-50% per year. In the next year alone, US shale production could easily fall from 9 million barrels per day to 6.5 million without continuous investment in new wells. Additionally, many oil wells that are shut-in will never recover to their prior production capacity as oil reservoirs are damaged by these closures.
At some point this fall or in 2021, oil demand will snap back as the economy reopens and economic activities normalize. Some transportation industries that use oil like airlines may take longer to return to normal, but demand should recover to the upper 90 million barrels per day mark. The good news is that this will likely be above daily supply during this period as we think anywhere from 3-8 million barrels per day of supply is permanently removed by market forces and decline curves.
Unfortunately, investors that think oil prices will rebound sharply once we return to a period where the oil markets are undersupplied are going to be disappointed. In normal times economists suggests that any price is driven by supply and demand. However, what that formula forgets to account for is inventories. When oil inventories are at extremely high levels, they dictate price, not supply and demand. This is because inventories are a substitute for immediate production and the marginal cost is only the transportation price from storage to a refinery.
It could take one or two years for inventories to normalized at levels where supply and demand fundamentals recapture their influence on the oil price. It is possible that oil prices don't return to $40 for 2-3 years from today. The majority of shale companies will go bankrupt or be sold to the integrated oil companies for pennies on the dollar on their old valuations (we call these "take-unders" instead of "take-overs"). Even though shale stock valuations are reflecting this dire forecast, determining the ultimate survivors and losers is a speculative gamble that should be avoided.
Gold Market
We have spent very little time discussing gold in our quarterly letters. To be very clear we are not “gold bugs” and we are not in the camp that fiat currency will collapse in ruin.
However, the present set of conditions impacting interest rates, national deficits, and currencies suggest that it is entirely possible that gold is on the verge of experiencing a period of strong returns, not unlike the periods following the 2008 financial crisis or period of economic strife in the 1970’s.
First, low interest rates reduce the cost of carrying gold as cash earns no return. Secondly, the government is expanding the deficit to levels we have not seen since World War II in an effort to sooth the negative economic shock from the pandemic. Thirdly, the central bank is dramatically expanding their balance sheet in an effort to boost the supply of money in the economy. While the slowdown in economic growth is deflationary in the near term, the present set of conditions listed above could lead to elevated levels of inflation in the medium term.
If enough investors hold these views, whether ultimately realized or not, it will likely lead to strong performance for gold prices. There are already stories in the financial press about a shortage of physical gold as speculators clamor for the yellow metal. We would not be surprised to see gold double in price from its pre-crisis level of $1,350 an ounce.
As a reminder, looking at the chart of the crisis’s phases above, gold was $750 an ounce in the beginning of the Acceptance Phase. It peaked at $1,900 an ounce just 3 years later, representing a jump of 150%.
We believe the best way to take advantage of the potential for higher gold prices is to own equity in the gold miners. The gold miners as an asset class have been under-owned by large institutional investors for nearly a decade. This isn’t unusual as gold miners have underperformed the wider stock indices for almost 8 years. Over this period, the valuation multiple for gold miners fell from more than 20 times earnings to the mid-single digit range. It wasn’t without reason as these companies mostly levered up their balance sheets to do value destroying acquisitions at the top of the last cycle and green-lit massive new mine projects that came with significantly higher operating costs.
As it stands today, balance sheets have been de-levered and higher cost mines have been shuttered or abandoned. If gold prices rise materially as we expect, they will benefit from tremendous operating leverage as they realize the spread between the gold price and their all-in sustainable production costs. Many larger producers like Newmont, Barrick Gold, and Kinross Gold have operating costs below $1,000 per ounce and large reserves. They will realize a significant expansion in profits as gold prices rise.
We have initiated new positions in Kinross Gold in both the Concentrated Value Portfolio and Phoenix Fund.
Opportunities Betting Against Absolutes
There is a lot of uncertainty surrounding how the world might look after this pandemic subsides. Some aspects of how society responds to the crisis will result in small permanent changes, and various industries will undoubtedly be impacted from these transitions.
However, we would caution anyone from thinking in terms of extreme absolutes, because it is very atypical for large divergences in individual behavior to remain in place after the panic subsides. Human nature has a strong desire to return to what they view as the prior state of normalcy and they resist large wholesale changes. Every crisis or shock to society will naturally result in some market commentators making extreme predictions and speculating about future outcomes in absolutes, using words like “never,” “dead,” and “forever.”
We’ve all seen the dangers of using absolutes in the past. For example, after 9/11 several people proclaimed that they would never get in an airplane again. We all likely know someone who said this, but I bet they have been on a plane several more times since then. None the less, at the time Airline stocks collapsed, even those with decent balance sheets. The gains in these stocks over the next several years after 9/11 were spectacular.
When stock prices begin to reflect these absolutes, they can create amazing investment opportunities. One of our favorite examples is the predicted demise of the RV and yacht industries during the Global Financial Crisis. In 2009, Winnebago saw its share price collapse below five dollars. Analysts and the media were questioning why anyone would ever buy an RV again as gas prices were hitting new records, retires saw their nest eggs cut in half, and financing for large consumer discretionary purchases all but evaporated. The stock price suggested the industry would never recover. But a funny thing happened on the way to irrelevancy, people started buying RVs again. Two years later Winnebago shares were trading 3x higher, and seven years later they were 10x higher.
One example of thinking in absolutes that has already emerged from the current crisis is the outlook for cruise lines. There are several commentators suggesting that the cruise industry is all but finished. More than a few people have made statements to us like: “Who in their right mind would get on a cruise ship ever again?” We believe this is just another absolute that represents an amazing investment opportunity.
We believe there are still a lot of people in America whose bucket list includes visiting Alaska. The best way to do that will still be on a cruise ship. Likewise, other vacationers will want to visit the Caribbean in the winter months. The easiest and most affordable way to visit the islands will still be on a cruise ship. People will cruise again, maybe not in the next few months, but certainly over the next several years. This industry will recover and there will be an opportunity to buy shares in Carnival and Royal Caribbean. These companies have the balance sheets to survive for several months of no sailings.
The bottom line is when people feel safe and secure, they will go back to the way they want to live. We still believe there is a huge demand and excitement for traveling. Hotels, airlines, and even cruise lines will recover.
Concentrated Value
As 2019 came to a close, we believed the Concentrated Value Portfolio was in an excellent position for this coming year. We had a portfolio of high-quality companies trading at wide discounts to both the overall market and our estimates of their individual intrinsic values. Many of our companies had near-term catalysts that we thought could allow us to recognize strong gains in the coming quarters.
Of course this all changed on March 7th as it became clear to us that the COVID-19 was bound to become a global pandemic that would bring North America and Europe to its knees. Simultaneously, Russia and Saudi Arabia engaged in a price war, flooding the market with additional oil at the worst possible moment.
If a time traveler from April visited us on January 1st and told us the portfolio would fall 46% in the next 90 days, we would have never believed them. We admit we were not prepared for an event that would lead to mass quarantines and economic conditions on par with the Great Depression. We had large exposures to energy, consumer cyclicals, and basic materials. Seventeen of our twenty companies were negatively impacted by the virus with the exceptions being Gilead Science, Verizon and CVS.
Below is a table of our top and bottom five contributors to the portfolio return. As you will notice there are no oil companies in the bottom 5 as we moved quickly to eliminate our exposure to oil producers. We exited Devon, Hess, Occidental and Schlumberger. We knew the oil industry would be the hardest hit sector of the market with no chance for a recovery for many years.

However, as the market continued to plunge as liquidity disappeared the following week, we came to the conclusion we were in the Panic Phase of a new bear market. We broke out our bear market playbook and made two critical decisions. The first was to raise more cash as stocks would likely fall an additional 10-15% (which did happen). We exited our positions in Air Lease, Celanese, Ford, Glencore, Invesco, LyondellBasell, and Prudential. Unfortunately, these companies had business models that were severely impacted by the effects of the COVID-19 pandemic and their stock prices saw sharp declines.
The second decision was to redesign a portfolio that would outperform in the Acceptance Phase and be well positioned for the upcoming bull market that will ultimately materialize in the recovery Phase. This portfolio will have four groupings of stocks with the following themes: (1) companies that we believe will benefit from the pandemic; (2) companies that have seen their stocks crushed by the virus but will ultimately survive and recover; (3) companies that we believe have the strongest business models in the market; and (4) the traditional high quality companies that would normally be in our portfolio.
We have already completed the transition to our pandemic beneficiary bucket with new positions in Amazon, Abbott Labs, Berkshire Hathaway, UPS, and we retained our position in Gilead Sciences. We held on to our holdings in Toll Brothers, Nutrien, CVS, and Verizon for the traditional value bucket. We also added Fleetcor to this mix. For the best company bucket we bought Moody’s Corp and Republic Services. We are holding out for the potential retracement to the market lows that is common in the Acceptance Phase to complete this bucket with our eyes on adding CoStar, CME Group, Synopsys, and Visa. For the bucket of companies most impacted by COVID-19, we retained our positions in Royal Caribbean and Capri Holdings. We will similarly be waiting for another market drawdown to complete this group with our potential additions including: Delta, Liberty Braves, Marriott, Transdigm or Phillips 66. We continue to have 30% of the portfolio in cash to fund these future stock purchases.
Ultimately, this bear market and our new plan will result in materially upgrading our portfolio, and we are very excited about the prospects to retake lost ground over the remainder of the year. You can already see the impacts of this new strategy in our Top 5 contributors above with Moody’s, Amazon, and Berkshire Hathaway.
Dynamic Income Allocation
One of the main objectives of the Dynamic Income Allocation Portfolio (DIAP) is to produce less volatile returns than the stock market. We achieve this by creating a portfolio that emphasizes income and diversification from uncorrelated asset classes. This combination should allow the portfolio to realize a greater portion of the market’s return during a period where stock prices increase, and conversely a lesser percentage of the downside returns during periods of negative market conditions. Ultimately, this combination should produce superior returns with less risk.
The DIAP had achieved this objective across both positive and negative markets since its inception up until this February. Unfortunately, the portfolio did not provide the downside protection we would have expected during the bear market that materialized this quarter. The reason was entirely the result of our large position in Master Limited Partnerships (MLP’s). This asset class was unexpectedly impaired by the one-two punch of COVID-19 pandemic and oil price shock.
As we discussed above, it became clear to us over the weekend of March 7th that we were entering the Panic Phase of a new bear market. We thought that markets would likely face material downside at the market open on the following Monday. Additionally, we were concerned that MLP’s would fall significantly more than the market as the merits of their investment case had literally changed overnight. By the close of trading that Monday, MLP’s had fallen 41% in just two trading days and completely overwhelmed the benefits of the remainder of holdings in the DIAP portfolio.
Between the beginning of February to March 9th, the DIAP fell 15.7% and the S&P 500 declined 14.6%. Approximately 9.8% of the decline in the DIAP was due to our position in MLP’s. The remainder of the portfolio’s holdings did their job and fell by just half the market’s 15% fall through March 9th. Clearly, over-weighting MLP’s was a grave mistake.
By the time the quarter came to a close, the DIAP has declined -22.5% versus a fall of -19.6% for the S&P 500. The MLP’s inflicted a 10.9% drag on our results before we exited the asset class on March 9th. As you can see in the table below, the remainder of our asset classes except for US High-Yielding Equities outperformed the S&P 500.

In addition to just selling the MLP’s, we made the decision to take the portfolio to what we call “Max Protect.” This means lowering our equity exposure to only 30%, which is the lowest allowable allocation to equities per the DIAP’s mandate requiring a diversified portfolio. We also sought safer assets including Mortgage Backed Securities and Long-Duration Corporate Bonds. Additionally, we sold our REITs as we believed the pandemic would negatively impact retail, apartment, and commercial office properties. Below is a table showing the new allocation of the DIAP as of March 8th.

As we have now entered the Acceptance Phase of the current market panic, the portfolio remains in “Max Protect” and we are looking for pullbacks to increase our risk exposure to a more aggressive stance. This will result in us increasing our exposure to US High-Yielding Equities and High-Yield Debt. Both should offer excellent risk-adjusted returns as the market transitions to the Recovery Phase. We will also reduce our positions in safer assets like Intermediate-Term Corporate Bonds and Mortgaged Backed Securities that we would expect to lag in a recovery.
Despite the shift to a more conservative portfolio, the yield on the DIAP remains an attractive 4.2%. This still represents a substantial premium to US treasuries which are currently yielding 0.6%. The spread in our yield versus treasuries is 3.6%. Interestingly, this spread is larger than the portfolio generated over the preceding 12 months. During that period the portfolio was yielding 5.2% vs. 2.1% for treasury bonds, representing a spread of just 3.1%.

The sharp unexpected hit to MLP’s also exposed an error in our portfolio construction process that we have now corrected to ensure the DIAP doesn’t produce similar unacceptable results moving forward. We have made the following two changes to portfolio construction rules.
First, no subsector of an asset class will be allowed to have an allocation above 10%. Examples of subsectors include: Utilities, REITs, MLP’s, Mortgage Bonds, High-Yield Bonds, and Emerging Market Securities. If this rule had been in place, MLP’s would have been constrained to a 10% portfolio weight instead of 25%. Had these new rules been implemented in February, the portfolio would have declined just 10% during the February 1 through March 8 time period.
Second, larger asset classes that encompass a variety of sub-sectors in their respective category will not be allowed to exceed a 20% allocation. For example, larger asset classes include US Equities, International Equities, Preferred Shares, and Investment-Grade Corporate Bonds of various durations. These assets are less vulnerable to idiosyncratic risk than the subsector asset classes mentioned above.
We are confident these changes will ensure we don’t experience a similar downside capture in the future.
Lastly, it is important to reiterate the investment philosophy of the Dynamic Income Allocation Portfolio. The DIAP is designed to function as the core foundation of an investor’s portfolio by operating with the dual mandate of generating the highest current income possible while preserving capital.
Pelican Bay Capital Management attempts to achieve this dual mandate by only investing in asset classes that by themselves offer a current dividend yield that is greater than either the dividend yield of the S&P 500 or 10-year U.S. Treasury. In our view, elevated income can add stability to a portfolio and maximize the benefits of compounding through reinvestment.
We then construct a portfolio of these high-yielding asset classes with an emphasis on minimizing correlation of the overall portfolio and maximizing its diversification beyond the typical 60/40 stock/bond portfolio. We finally add a valuation overlay that we utilize across all our portfolios. We allocate a larger position weighting to the most undervalued and attractive investment opportunities, while avoiding owning overpriced assets.
Phoenix Fun
Please note: The Phoenix Portfolio is only available to “Qualified Clients” pursuant to section 205(e) of the Investment Advisors Act of 1940 and section 418 of the Dodd-Frank Act.
The Phoenix Fund utilizes an investment strategy that we define as “Distressed Equity.” The objective is to invest in companies that are experiencing severe financial headwinds that have resulted in their common shares being liquidated by large institutional investors. We sift through these remains trying to identify companies that we believe can avoid bankruptcy and have the capability to overcome their headwinds that are often cyclical in nature. As investors gain confidence in these companies recovering, their stock prices can rebound substantially generating outsized returns.
Of course the potential for high returns comes with a greater degree of risk. Our portfolio can succumb to two risks in particular. The first is that our assessment of a company’s ability to rebound can be wrong. For the most part, this outcome has been a rare occurrence for us, impacting less than 10% of the names we have owned since inception. Some examples are Cloud Peak Energy, Roan Resources and Deutsche Bank.
The second risk is that performance can suffer in periods of negative markets. When stock indices are falling, companies that have already been performing poorly are the first things to get sold as investors look for higher ground. During market corrections its not unusual for our portfolio to fall twice as much as the market as investors unload risk. The current crisis is no exception, and the Phoenix Fund fell by half, down -56% in the first quarter.
Frustratingly, since the inception of the Phoenix Fund in October of 2018, a period of just 18 months, we have already experienced two bear markets and a correction. However, this period of tumult and setbacks is laying the groundwork for strong future investment returns. The current market stress has brought the 11-year bull market to its definitive conclusion. Once markets enter the Recovery Phase, a new bull market will emerge that should be able to produce positive market returns for several years. At the same time, this current market panic is offering up higher quality companies that we can add to the portfolio, some that we normally could never invest in. Despite the poor returns in the first quarter, we strongly believe that our portfolio is poised to live up to its namesake. For investors looking to deploy new capital, now would be a good time to consider investing in distressed strategies.
Turning to individual stock performance, the only positive results came from the trading bucket of our portfolio. We participated in the merger arbitrage of Sprint Corp for a second time, realizing an absolute return of 71% as T-Mobile closed the transaction. We also put a small short position in place as losses accelerated.

The bottom five contributors demonstrated how fast distressed companies can fall as the market becomes extremely bearish. The most disappointing part is that absent the COVID-19 pandemic we would have likely been exiting GoGo and Hovnanian after tremendous success. Both companies had achieved excellent first quarter results and were preparing bullish outlooks for the remainder of the year.
Our energy stocks suffered sharply and that is with selling Transocean and Denbury in early March. The only energy company we have retained in the portfolio is Gran Tierra. This is because they are not a shale producer and have the balance sheet to survive our expectations for a multiyear oil downturn. Insiders are buying the stock aggressively and they remain one of the few energy companies that have seen this type of support.
Subsequent to the quarter’s end, we also took several new positions that have already had strong performance. We returned to Kinross Gold which we had owned successfully in the past. We also added Capri Holdings and Oaktree Specialty Lending at the bottom. We have owned both of these companies in our Concentrated Value Portfolio.
We have also initiated a position in Nordic American Tankers. This company owns 24 Capesize crude oil tankers that have seen their day-rates spike to $50,000 and $80,000 per day as oil companies are desperately locking up ocean tankers to store excess oil as traditional storage fills up. Normal rates are in the $15,000-$30,000 range and Nordic American’s operating cost are approximately $8,000 per day per tanker ship. We think the company can generate $250-$400 million in free cash flow in 2020 compared to a market cap of just $500 million when we acquired the shares. Moreover, the company has a solid balance sheet and a history of returning all the free cash flow to shareholders
We also have our eyes on additional high-quality companies that now meet our requirements for inclusion in the Phoenix Fund. As markets retrace to recent lows, we will be adding these companies to the portfolio at very attractive prices.
Finally, we wanted to revisit the investment philosophy of the Phoenix Fund. The portfolio takes advantage of structural biases against institutional ownership of financially levered companies with low-stock prices. We seek companies that have had their stock prices fall 70% or more in the last two years and are priced below $10 dollars per share. This outcome typically leads to forced selling from their institutional shareholders, creating the opportunity to make outstanding investments for less constrained investors.
Generally, these companies are under distress from poor performance caused by what we believe are temporary factors. These companies typically have elevated levels of debt, and any prolonged period of business stress could cause stockholders to endure substantial losses. The Phoenix Fund is a high-risk, high-return investment strategy. Please see the Risk of Loss Section of Part 2A of Form ADV referenced below.
* * * * * * *
In closing, we would like to thank our investors for their continued support during this market downturn. We also want to extend a warm welcome to our new investors. We are looking forward to the future and achieving your investing goals with integrity and discipline.
We are very excited about the potential future returns for each portfolio. We have made all the necessary adjustments to our portfolio holdings to meet the challenges of the next several months and take advantage of the recovery that will ultimately materialize.
Warm regards,

Tyler Hardt, CFA