To view this letter in PDF Format please click here: 2019-Q3 PBCM Investor Letter.pdf

Dear Investors;
We would like to begin by welcoming our new investors to our funds and thank our existing investors for their continued support. Despite the volatile gyrations in markets during the third quarter, Pelican Bay Capital Management continues to invest for the long-term and deliver on our investment mandates and objectives.
Our quarterly results for each portfolio and the S&P 500 are in the table below.

The layout of this quarter’s letter will start with a general market commentary, followed by individual reviews and analysis of each of our portfolios including Concentrated Value, Dynamic Income Allocation, and the Phoenix Fund.
As always, if after finishing this letter you have any questions or would like to discuss any topics in greater detail, please don’t hesitate to call us at 239-738-0384 or send us an e-mail at tyler@pelicanbaycap.com. We welcome your feedback and look forward to your correspondence. Additionally, we encourage you to share our letter with whomever you like.
Market Commentary
The market volatility that we experienced in the second quarter carried into the third quarter without missing a beat. As you recall, the current troubles started in May following the collapse of trade talks between the US and China. The selloff we saw in the second quarter that especially impacted risker assets and stocks that underperformed year-to-date continued into July and accelerated sharply in August. A relief rally emerged in September as the most beaten down stocks finally caught a bid.
The debt markets were not immune from the volatility as interest rates declined sharply in the quarter. The yield on 30-year US Treasury bonds fell to an all-time low, plunging through the 2.0% threshold. 10-year Treasury yields fell sixty basis points (0.60%) to just 1.5%. The yield curve briefly inverted where 2-year Treasury Notes were yielding more than 10-year Treasury Bonds. The inversion lasted for only a few days. The spread has since widened back to 12 basis points (0.12%).
While the 2-10 year spread is no longer inverted, it is still alarmingly flat. The inversion has been a decent predictor of recessions in the past with only a single exception. The curve did invert temporarily in 1998 and no recession immediately materialized. We are hoping for a similar outcome with the current inversion as the consumer still appears to be strong enough to prop up the economy, even with the current decline in manufacturing activity.
If you can recall from last quarter’s Investor Letter, we had urged caution amid elevated levels of uncertainty and high stock valuations. We expected some market volatility to continue, but the sharp deterioration we saw in August, despite improving business fundamentals across many of our equity holdings, quit frankly took us by surprise. The experience reinforces our prior decision to move to a more cautious investing posture.
We will comment further on our investing outlook below. However, we would first like to address three topics that we believe deserve special attention as they are influencing our investment views moving forward. These include: The U.S.-China Trade War; Value vs. Growth Stocks; and Energy Markets.
Trade War is Driving the Equity Market
In our opinion the market has behaved very unusually over the past half year. It reminds us of 2002 when investors were obsessed over the uncertainty surrounding the US’s unilateral decision to invade Iraq. At the time, the uncertainty of the war outweighed the fundamentals of an economy that was clearly emerging form a shallow recession.
Today the market appears to solely be driven by the current status of the Trade War posture emanating from the Oval Office. It is our observation that every time the market rises near all-time highs Trump takes a shot at the Chinese with further escalating tariffs, blacklists, and/or sanctions. The market falls in response to this negative trade news. After the market falls 4-6% Trump eases his rhetoric and quickly produces an olive branch to the Chinese or issues a tweet that a trade deal is imminent. The positive reversal boosts markets back to its recent high. Then Trump goes negative on trade again and we repeat this cycle over and over.
It is widely believed that Trump views the stock market as a score card for his presidency. It appears to us that when the market is looking good and near its highs, Trump believes he has chips to play with and lashes out; only to reverse course if the markets fall too much.
In this environment it appears to us as if equity values have almost completely unhinged from underlying fundamentals. For example, there were three meaningful and unexpected events that took place during the week of September 16th that in a normally functioning stock market would have a significant negative impact on stock indices. First, the heart of the Saudi Arabian Oil Infrastructure was attacked by a cruise missile strike allegedly initiated by the Iranians that resulted in oil prices rocketing up 16%. Second, the Federal Reserve Open Market committee met and indicated that there would be no more rate cuts this year, despite the market’s expectations for a further 50 basis points of cuts in 2019. Thirdly, the overnight repurchase market which is where banks get near -erm cash funding had completely gone berserk and the lending rate for immediate cash from the banks skyrocketed to 10% from 2.5%. This violent move in the repo market is not normal and hasn’t been seen since the days of the financial crisis. Most worryingly, we have yet to hear a good explanation on what is causing it.
Amazingly, not one of these three events caused the market to move more than half a percent. Later in the week, and subsequent to these three events, news reports surfaced that an advance team of Negotiators from China, who were visiting the US to prepare for the upcoming resumptions of trade talks, had canceled their visit to Minnesota where they had originally planned to meet with farmers. This triggered a sharp 1.5% selloff in the market. There was no explanation for why the B-Team from China canceled their layover on the way back to Beijing, but the market panicked none the less.
In a market driven by fundamentals, the news on the Chinese trade delegation shouldn’t have had a larger impact on markets than the three other events. We think most market observers would concur with us that the other three have real impacts on economic fundamentals and forecasts that should ultimately drive markets. This confirms to us that the only thing really driving stocks right now is trade talk rumors and announcements. Even as we write this letter, the leading headline on CNBC is “Stocks hit on dimming trade deal hopes.”
At some time in the near future both parties will come to a point where they ultimately agree to either (1) a comprehensive trade deal; (2) a smaller deal that lifts all tariffs; or (3) the mutual acknowledgment that no deal will ever materialize, and each party abandons all negotiation efforts. The veil of uncertainty will be lifted, and this will be the moment when business and economic fundamentals matter again. We expect investors will look around and see a lot of value, causing stocks to break out of their recent range and move higher, much the same way they did when we finally started dropping bombs in Baghdad in March 2003 (it was in fact the day the 2000-2002 bear market ended).
Rotation from Growth to Value?
The third quarter wasn’t all doom and gloom for market participants. There was one unexpected development that emerged in September; and that was the sharp rebound in value stocks performance relative to growth stocks. The Bloomberg US Pure Momentum Portfolio, which buys stocks with the highest returns over the past year and shorts the worst, suffered through its worst 10 day stretch since 2000.
Growth oriented stocks have been on a twelve-year outperformance streak vs. value stocks. This is the longest period of outperformance for growth since the S&P started tracking value factors. The divergence in valuation and market performance of both categories of stocks is at all time highs and is only matched by the gap we saw during the tech boom in 1999.

At Pelican Bay Capital, we have a strong faith in reversion to the mean. It is one of the primary factors that supports why value investing works. The chart above looks positive to us.
Since the gap in performance between growth and value is back to all-time highs, it indicates to us that the odds are significantly higher for value to outperform growth over the next 5 years. This will lead to significant outperformance for our strategies as we lean heavily on value stocks. The last time the divergence was this wide, value stocks snapped back aggressively and generated a positive absolute return throughout the overall bear market of 2000-2002. Value investors who endured the pain of the tech bubble, felt pretty good about themselves over the next decade.
We felt this impact of the momentum shift in our portfolios in September, particularly in the Phoenix fund which over a two week stretch in early September rebounded 32% from sharp declines in July and August. This return is even more impressive considering the portfolio had a 50% cash position at the start of the rebound. We had been trailing the market significantly quarter to date before the rebound and ultimately led to a positive return in the third quarter.
Is the transition from growth to value sustainable? It’s always difficult to call the transition between growth and value stocks as it will take several quarters to determine whether this shift is sustainable or is another head fake like we experienced in early 2016. But we suspect that when we look back to September several quarters or years from now, it will mark the flip to value outperformance we have been waiting so long to begin.
The primary reason for our optimism is the backlash against wildly overvalued profitless Unicorn stocks that emerged in September. High flying software stocks and recently IPO’d profitless Unicorn companies had the worst quarter in this decade-long bull market. When market historians write the final chapter on this decade-long outperformance of growth investing, we think it is likely they will highlight either the Uber or WeWork IPOs as the turning point at which the growth market frenzy peaked and rolled over.
Energy Market Narrative
One of the largest detractors to our performance across each of our funds this year as been the dismal performance of energy related securities.
Our investments in energy has been predicated on the view that low oil prices over the last 4 years, which has averaged $55, are below the marginal cost of production. This has restrained industry CAPEX and exploration spending that will ultimately lead to lower oil production moving forward. As the industry spends less, there are fewer big projects that will come on stream and decline rates at existing fields will accelerate. Over this period of low prices annual oil demand growth has proven to be remarkably stable at around 1.2 million barrels each year.
We believe there is a point where the dearth of new oil development and continued demand growth result in the oil market entering a chronic undersupplied condition. This would result in inventories falling below average, causing oil prices to rebound above their marginal cost to encourage new investment to expand production growth. We think the marginal cost of new oil production is somewhere between $65-$80 per barrel, well above current prices.
After several unsustainable oil price rallies, investors have all but given up on oil companies. The weight of the Energy Sector in the S&P 500 has fallen to an all time low of just 2.8%. Most portfolio managers feel that they can avoid the sector entirely without any consequences to their performance vs. the benchmark. For the last 4 years, they have been right.
The pessimism towards energy has been driven by the widely held narrative that Shale Oil Producers can make money at $50 per barrel, and at this price they have the capacity to increase production by over one million barrels per day each year.
We strongly believe this is a false narrative. It doesn’t conform to reality and flies in the face of widely available facts and data on the Oil Industry. Let’s break this into two parts and analyze the available data.
Firstly, lets evaluate the view that “$50 works.” The oil price has averaged $58 over the last two years; $8 higher than where Wall Street Consensus believes the industry makes money. The E&P Companies must be making bank in this environment, right?
Wrong. Despite actual oil prices coming in 18% higher than their self-proclaimed $50 breakeven costs, the US E&P industry is not even close to being profitable. Cumulatively, the industry has been bleeding billions of dollars in negative free cash flow in both 2018 and 2019. Twenty-eight shale companies have gone bankrupt so far this year and we have 3 months to go. The industries financial results should speak for itself. $50 oil doesn’t come close to working for the shale oil producers. Why the market continues to tout “$50 works” is completely lost on us.
Secondly, shale production is a none-stop growth machine. We will admit up until December of 2018, the US shale industry has grown like crazy and was logging 1 million barrels a day or more in annual growth. In the last three years they have grown from 4 million barrels per day in production to 8 million barrels per day. So there initially was some truth to the consensus view on US growth.
But then a funny thing happened. US oil production stopped growing and has been completely flat from November 2018 through July of this year (the last month that confirmed oil production data is available from the Government). That is 9 months of zero growth. US oil production is essentially stuck around 12.0 million barrels per day give or take 100,000 barrels. Look at the actual monthly data below and ask yourself if the US oil production is booming?
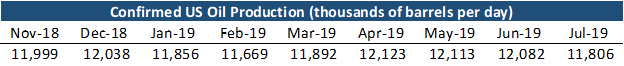
Yet, we have seen almost no market commentary on the flattening growth. Additionally, we think it will be hard for production to grow much from here. In fact, there is a reasonable probability that we will begin to see negative year-over-year US oil production numbers in the coming months. If this happens, it will be tough for Wall Street to ignore.
We believe the large decline in oil rig activity should result in lower production than the market is expecting. In order to produce new oil, the industry must first drill wells. The US oil rig count peaked at 888 rigs in November of 2018. It currently stands at 710 rigs and has been falling at an accelerated rate. This is a 20% decline in activity.
Why is the industry dropping so many oil rigs? To harken back to our earlier point, it’s because the shale producers are losing money at $58 and they must cut their CAPEX (think oil rigs) as they they are running out of cash.
We believe there is approximately a six to eight-month time delay between when a rig shows up in the rig count numbers and when oil starts flowing from the wells it drilled. It is going to be very difficult to sustain US oil production growth with 20% less oil rigs. The July production numbers that were recently released are 8 months after the US rig count peaked. In the coming months we should know whether our analysis is correct or not. If validated, our portfolios are position to perform very well.
Unfortunately, some market narratives are so pervasive that they can sustain themselves in the face of overwhelming contrary evidence. If you remember, as late as 2007 many people still believed the refrain that US house prices have never gone down at the national level. This was despite the fact that the housing market had peaked in 2005 and was already falling. That false narrative also ignored the fact that the national housing markets fell in the 1930’s, early 1980’s, and 1990. It was simply not true, but went unchallenged by economist and investing experts despite the abundance of conflicting evidence.
When will the market wake up to the reality that $50 oil is too low to fund further production growth? Your guess is as good as ours. But at some point, the facts will prevail, and you will want a decent exposure to oil when that happens. Famed Venture Capitalist Peter Theil wrote in his book “Zero to One” that if an investor wants to make a lot of money, they must only ask themselves one question: “What important truth do few people agree with you on?”
Looking Forward
Looking forward to the coming months we believe that markets will remain volatile. The landscape is no different than when we began the third quarter; (a) asset prices that remain richly valued; (b) a global economy continues to show signs of contraction; and (c) there is elevated levels of uncertainty for investors. There remains to be several near-term binary events that have unknowable odds that could produce negative outcomes and have material impacts on asset prices. We think the market continues to be driven by developments in the Trade War with China, and we really have no great insights into how it will progress moving forward.
None the less, we remain constructive in our near-term investing and economic outlooks in which we see a slowdown but not a recession. We continue to find attractive opportunities in this market. Our base case is that the bull market will carry on and the current slowdown will pass, much as it did with similar economic slowdowns in 2011-2012 and 2015-2016 when the market outlook was eerily like todays. It is important to remember that not all slowdowns lead to recessions and their associated bear markets. It mostly happens when an existing slowdown develops concurrently with a large negative shock.
Since our base case and analysis of the current investing environment is unchanged from last quarter, Pelican Bay Capital Management will continue to operate with an abundance of caution and prudence overlaid with a constructive view of the markets.
However, our long-term view on total equity returns remain challenged. While value stocks look cheap, the overall S&P 500 is still relatively expensive. From the current level of 3,000 we believe that long term investment returns could be as low as 2-5% over the coming decade; much less than the 13% annualized we achieved over the last 10 years.
Given these low expectations, we believe the opportunity to produce superior returns in both the near-term and over the next decade, lies in the combination of (1) owning value stocks vs growth stocks, and (2) securities with higher dividend yields. We have made the case for a value orientation above. However, income will make up a much larger portion of total returns from here, so investors that maximize income will be much better off. Our portfolios are positioned well for this long-run outcome.
Concentrated Value
The concentrated value portfolio ended the quarter in positive territory with a return of 0.8%. However, we were disappointed in the performance this quarter. Our decision to overweight the Energy Sector continues to burden our returns and has offset our better stock picking elsewhere. Excluding our energy names, the portfolio would have returned a respectable 3.3% in a challenging investing climate.
As we have already addressed our views on energy markets above, we will be brief in commenting further here. It is important to reiterate that we believe energy price must be higher to support the necessary supply growth needed to meet future energy demand. If we are correct and the market also comes to this realization, the portfolio is poised for significant gains. We remain patiently invested and will keep scanning the energy landscape for disconfirming evidence that suggest our views are wrong.
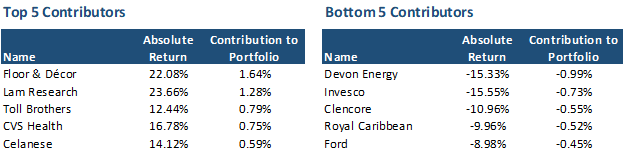
Turning to individual results for the quarter, we continue to see strong results form Floor & Décor, Lam Research, and Toll Brothers. These had been our three best performers since inception and they continued their leadership in the third quarter. On the negative side of the ledger was shale energy driller Devon Energy, Invesco and Glencore. Cyclical and commodity linked names underperformed as worries about weaker global economic growth are being priced into stocks.
The success at Toll Brothers and Floor & Décor is primarily related to the recent recovery in the US housing industry. A little over a year ago, the housing market started showing signs of strain. The spring 2018 selling season had underperformed expectations as rising mortgage rates and housing prices lead to a decrease in home affordability. Rising labor and lumber prices, combined with higher sales incentives, were squeezing home builder margins.
All the homebuilder’s stocks fell in unison irrespective of individual performance. Toll Brothers was weathering the downturn better than other builders given their strong balance sheet and growing sales in California. They saw their shares nearly cut in half as the stock fell from $53 down to $28. We bought our shares for $32 which at the time was selling for 0.8x price-to-book ratio and just 6.8x price-to-earnings ratio. Toll Brothers is a high-quality outfit and deserves much higher valuations. We think the fair value for Toll Brothers is worth $48-$64 per share. It trades for only $41 today.
It is our belief that since the financial crisis the housing supply has lagged US household growth. Additionally, we believe once the millennials start forming families and having children they will want to move from their apartments to a home. This much delayed exodus of millennials moving from the cities to the suburbs has begun in earnest, and millennial populations in city centers has been declining for 4 years in a row.
Floor & Décor (FND) is a big box retailer that specializing in tile and wood flooring. They are a younger company with just 100 stores and are expanding rapidly with realistic goals to have around 300 or 400 stores. They have created a superior operating model that utilizes a 75,000 square foot store, allowing the company to better display a larger variety of tile and wood product options. They also have the product on site, so buyers can leave with their purchases immediately instead of placing an order that could take days or weeks to deliver. This capability is especially valuable to interior designers and contractors.
Competing concepts with much smaller footprints like Lumber Liquidators, Tile Shoppe, Home Depot or Lowes simply cannot match FND’s superior selection or product availability. Based on recent quarterly results from competitors, FND is clearly taking market share, and I expect them to continue to do so for the foreseeable future.
Like Toll Brothers, Floor & Décor’s stock price was down by a little more than 50% from its 2018 high when we initiated our position in the stock. Since our purchase, the shares have doubled and are very close to their 2018 high. The stock currently trades for $49 and we believe it could be worth $50-$80. We trimmed our position slightly as it jumped in the second quarter. If the stock continues to perform well and moves further into fair value, we may trim some more of our position. But this company has a very long runway for growth. Barring some crazy valuation in the future, we expect to be long term owners.
Invesco was a standout loser this quarter after falling sharply in July. Many of our stock holding rebounded in the September rally except for Invesco. Shares have now fallen 25% since we purchased the stock near $21 last year. The only companies we own in the Concentrated Value Fund that have fallen more are the E&Ps companies.
Asset managers have fallen further out of favor as worries over fee pressure continue to mount. However, we continue to believe that future fee pressure is more than factored into the stock price. At its most recent price of $15, the price-to-earnings ratio is a very low 6.3x estimated earnings. The market by comparison is trading for 18x earnings. This discount implies an imminent collapse in the company’s earnings and free cash flow. We don’t believe this is a realistic outcome. The asset management industry is consolidating as larger players consolidate assets to maintain their revenue streams. Invesco is in this group and should be a survivor when over the medium term. We think shares are worth $25-$30. In the meantime, the company is paying us a sustainable 8% dividend yield (their dividend payout ratio is about 45%), and the company has started buying back shares.
Given the elevated volatility we saw this quarter, surprisingly there was little buy or sell activity. Towards the end of the quarter we made the decision to sell our position in Apple. Our Apple investment worked out very favorably. We purchased our shares in Apple for approximately $170 per share and sold them for $220. Apple is a great company, but at $220 it was trading for a market multiple. We see several new risks on the horizon which makes us think that the stock should be trading for a discount to the market in the near term.
First, Apple is very exposed to China with $44 billion in revenues generated from that country in the last year, representing almost 30% of their iPhone business. Apple also manufactures the majority of their iPhones in China. If trade talks deteriorate there is a material risk that nationalist zeal from Chinese consumers could cause material harm to their earnings power and valuation.
Secondly, the iPhone drives roughly 60% of their profits and they are entering a perilous time in their development cycle that could cause real short-term dislocation in their business. First, the new iPhone 11 has minimal new advancements from the iPhone X besides new camera technology. However, the price point for the new iPhone 11 is almost $400 below the iPhone X. In the last few years Apple pushed iPhone pricing to hard and they are recalibrating. This could squeeze profits. You might think that the lower price could encourage more unit sales and make up the difference from the lower price. However, the prospect of a 5G phone in the near future will likely cause consumers to hold out for the iPhone 12 which is expected to come out in another year and boast 5G compatibility. There is a high level of risk that consumers will sit this product cycle out.
Considering both of these factors, there is a high probability that Apple could face some serious issues in the near-term forcing pressure the stock. In our analysis it was trading in its fair value range and it made sense to book the short-term profit. We wouldn’t be surprised if we can repurchase our position at a much lower price in the next few quarters. In the meantime, we are sitting on cash with only 19 holdings. We are on the lookout for a new stock to bring us back to 20 names in the portfolio; which is the limit in the number of companies we can own in the Concentrated Value Portfolio.
Lastly, we wanted to revisit the Investment Philosophy of the Concentrated Value Portfolio. We utilize a value investment strategy that seeks out companies for investment which the Portfolio Manager deems to be high quality companies. Quality is defined by possessing business operations with durable competitive advantages, allowing for high returns and growing cash flows streams. We want these high-quality companies to also have solid balance sheets, preferably with a net cash position. We also prefer that their management teams make decisions with an emphasis on maximizing shareholder returns.
Once we find these high-quality companies, we generally only invest in their stock if they trade at a steep discount to our estimate of their intrinsic value. This is necessary to provide our investors the opportunity to generate an above market return and protect capital. This discipline creates a wide margin of safety if an undesirable scenario plays out in the future. Pelican Bay Capital Management believes that identifying a significant difference between the daily market value of a security and the intrinsic value of that security is what defines an investment opportunity.
Dynamic Income Allocation
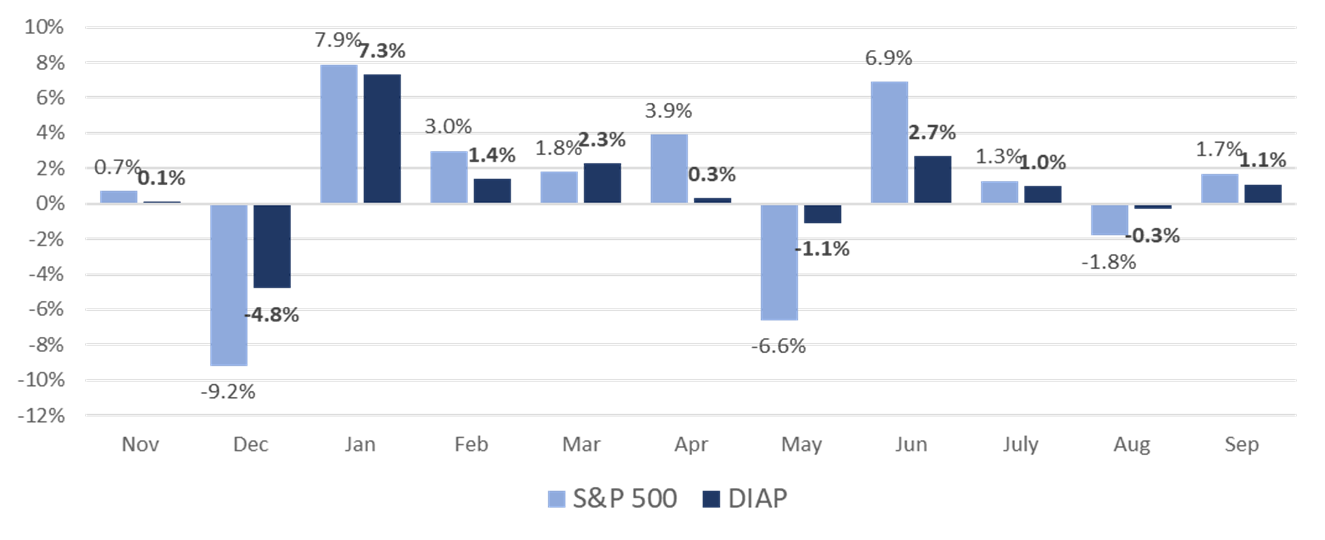
For the third consecutive quarter the Dynamic Income Allocation Portfolio (DIAP) continues to generate a solid risk adjusted return in these volatile markets. The portfolio generated positive returns in July and September, and it was slightly negative with only a -0.3% return in August during the steep selloff in the S&P 500.
The DIAP was conceived with the primary goal of providing a source of stable returns for investors in most market environments. This multi-asset class portfolio is thoughtfully designed with uncorrelated assets that should produce elevated levels of income (the yield is currently 5.1%) while minimizing volatility and maintaining a stable principal balance. While the portfolio is constructed to provide stability, it has performed much better than we initially anticipated. The DIAP’s lack of volatility is none the less remarkable given the wild swings in stock prices.
Since inception, the DIAP has proven to be far less volatile than the S&P 500 and has delivered an 9.21% total return with 2.9% monthly standard deviation. By comparison, the S&P 500 Index has increased 10.7% with 5.2% standard deviation. On average the DIAP has participated in 60% of upside return in months when the S&P 500 gained, but only 35% of downside in months with negative returns.
One of the major contributors to the stability of the portfolio is its elevated income yield. Income can act as a shock absorber in difficult markets. Income is always a positive contribution to return and can partially offset negative returns from decreasing valuations. Additionally, income acts as a tether for underlying valuations as higher-yielding assets tend to have valuations more closely tied to the discounted future payments of their income. This results in a higher likelihood of trading in line with their economic fundamentals.
At Pelican Bay Capital Management, we think an investors’ long-run expected return is in a fixed range of potential outcomes between 5.5-9.0% annual return. This is based on decades of returns for diversified portfolios. It is important to recognize that the overall return is comprised of just two factors; (1) income from dividends and interest and (2) capital gains from asset appreciation.
We view the income portion of the investor’s return as being a fixed rate with almost no volatility and little risk. We consider income to be the starting point to generating the ultimate return on investment.
Conversely, the portion of the return from capital gains is responsible for all of the volatility and risk that determine the reminder investors’ long-run rate of return. The return from capital gains is a combination of long-run economic growth, inflation, industry profit margins, and valuation multiples. These factors are unknowable and drive the uncertainty that causes returns to drift towards the upper end or lower end of its long-run range of 5.5-9.0%.
Most importantly, by increasing the portion of investment returns that come from income, the investor can minimize the portion of his return that comes from the inherently volatile capital gains. Thus, the investor can achieve the same long-term return while taking significantly less risk as they rely on a smaller portion of the return coming from capital gains. We detail this in the chart below.
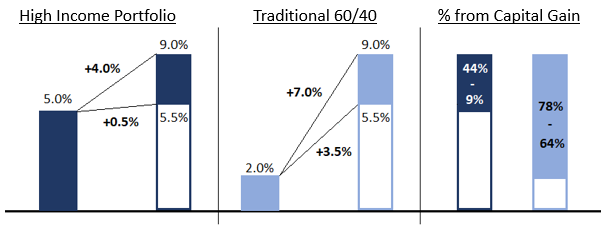
The higher portion of total return that comes from dividends leaves less of the return that must come from capital gains. As you can see, all of the portfolio’s volatility lies in the capital gain. Lower volatility leads to superior long-run investment returns. This is the core of what makes the DIAP our recommended strategy to serve as the core foundation for most investment portfolios.
The current yield on the DIAP as of October 7, 2019 is 5.1% annualized. The current investments have dividend yields ranging from 3.1% to 8.6%, compared to the S&P 500 dividend yield of 1.9% and 10-Year US treasury of 1.56%.

We like to compare the returns of the DIAP against the typical 60/40 stock/bond portfolio that is often recommended as a default by Investment Advisors. We believe that exposure to additional asset classes beyond the typical 60/40 portfolio combined with a preference for income and the utilization of a tactical value overlay should produce superior investment returns with less risk.
We narrowly missed our goal this quarter but remain ahead for the year. In the second quarter the DIAP generated a 1.21% return after fees, which trailed the no-fee 60/40 benchmark by 78 basis points (0.78%). The total returns of the SPY and AGG ETFs were 1.76% and 2.34% respectively in Q2, resulting in a benchmark return of 1.99%.
Once again, the underperformance in the DIAP relative to the 60/40 benchmark was primarily driven by weakness in MLP’s which produced a negative contribution to the portfolio’s return of -1.31% in the quarter. We continue to believe that MLP’s remain tremendously undervalued. Their value is depressed because the group continues to get lumped in with traditional energy stocks by most investors. As oil prices fell in Q3, MLP’s declined in tandem due to this misplaced view.
The reality is that MLP’s have business models that more closely resemble toll roads, as they primarily benefit from increasing oil and gas volumes, rather than changes in commodity prices. With the explosion of US shale growth, the industry is growing pipeline capacity at elevated levels and higher pricing that will ultimately lead to higher investor distributions. In most markets there is a shortage of pipeline capacity resulting in pricing power for MLP’s.
At some point, MLP’s generous yields and potential for dividend growth will force investors to rethink their historical framework for valuing these companies. MLP’s correlation with energy prices will decline and ultimately reflect the stable toll roads they have become.
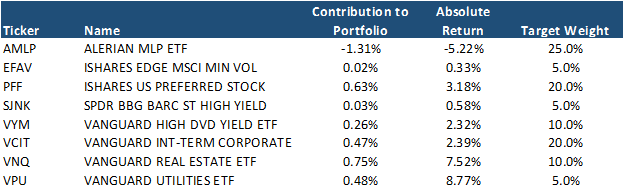
The rest of our asset classes generated positive contribution to the return in the third quarter. Real Estate and Utilities were our star performers. They were responsible for more than all of the portfolios performance in the quarter, generating a 1.23% contribution to returns.
Once again, this quarter we are changing the portfolio allocation for the DIAP. However, the change will only have a small impact on the portfolio. We have made the decision to change our favored ETF that we utilize to get exposure to high-yield corporate bonds. We are swapping HYG for SJNK, but we are leaving the target weighting of 5% in high-yield debt unchanged.

We are making this transition because the SJNK ETF had greater exposure to the risker parts of the junk bond market. A higher portion of this ETF’s holdings are represented by lower-rated B and CCC corporate bonds. With more evidence that the global economy is slowing, we think credit spreads for lower-rated corporate bonds (especially CCC rated debt) are not increasing enough to account for the environment. HYG has a higher weighting to BB rated corporate bonds that we think will generate superior returns vs. lower-rated debt if the economy deteriorates further.
Lastly, it is important to reiterate the investment philosophy of the Dynamic Income Allocation Portfolio. The DIAP is designed to function as the core foundation of an investor’s portfolio by operating with the dual mandate of generating the highest current income possible while preserving capital.
Pelican Bay Capital Management attempts to achieve this dual mandate by only investing in asset classes that by themselves offer a current dividend yield that is greater than either the dividend yield of the S&P 500 or 10-year U.S. Treasury. In our view, elevated income can add stability to a portfolio and maximize the benefits of compounding through reinvestment.
We then construct a portfolio of these high-yielding asset classes with an emphasis on minimizing correlation of the overall portfolio and maximizing its diversification beyond the typical 60/40 stock/bond portfolio. We finally add a valuation overlay that we utilize across all our portfolios. We allocate a larger position weighting to the most undervalued and attractive investment opportunities, while avoiding owning overpriced assets.
Phoenix Fund
Please note: The Phoenix Portfolio is only available to “Qualified Clients” pursuant to section 205(e) of the Investment Advisors Act of 1940 and section 418 of the Dodd-Frank Act.
We are extremely proud of our results for the Phoenix Fund this quarter. The portfolio posted a 2% gain despite precarious market conditions, where riskier assets were mostly shunned by investors. We are cautiously optimistic that the negative market influences that have curtailed our returns this year could finally be subsiding. We are hoping some of the improving market fundamentals we witnessed in the Phoenix Fund in September continue into the fourth quarter.
But we must caution that market sentiment is still mostly driven by trade war rhetoric and not any underlying fundamentals. We are well aware that the small green shoots we are seeing in the Phoenix Fund could reverse with a single tweet.
Additionally, we are pleased to report that the new position weighting scheme that we put in place at the end of the second quarter worked very well in the face of continued volatility. We were able to reduce risk and raise cash as the markets deteriorated in July and August. Yet despite higher levels of cash, the portfolio still managed to generate a strong recovery in September where it jumped 17.8% as some of our more favored names generated strong gains. Concentrating our holdings in names that we believe have higher probabilities of experiencing near-term recoveries worked particularly well.
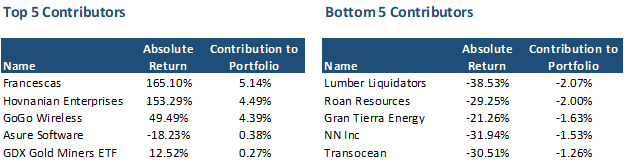
Turning to the Portfolio’s results for the third quarter. We enjoyed substantial gains in two of our most out of favor stocks. Francescas and Hovnanian were the second and third best performing stocks in the entire market during the third quarter with returns of 154% and 131% respectively. Hovnanian and Francescas strong performance occurred entirely in September as these companies benefited from positive quarterly earnings releases.
Interestingly, the reported earnings results at Hovnanian, a national homebuilder, were strikingly similar to their second quarter’s results where the stock fell 30% after their earnings release. Both community count and home sales continue to rebound. As we noted in last quarter’s letter, we were surprised the Hovnanian fell 30% after posting unexpected positive results that we believed had clearly demonstrated that their recovery was well underway. We guess at some point, the market had to acknowledge the improving results. None the less, shares of Hovnanian remain undervalued even after leaping 153%.
Francescas, is a US retailer that has struggled to stay relevant. Their main issue is that they grew too fast and relied on a related-party manufacturer for their apparel which inflated margins under prior management. A restructuring expert has managed to stabilize the decline in sales and led the company back to profitability. Their future looks bright as newer inventory is selling well at better margins, and management has begun closing underperforming stores.
At its low of just $4 per share in August, Francescas had a market cap that worked out to just $18,000 per store. To put that in perspective, the cheapest retail store we could find for sale in the state of Florida was a 1,500 square foot store that sold batteries under the Batteries Plus franchise for $45,000. Most individual retail stores sell for $100,000-$250,000. A Francescas store is probably worth $150,000-$200,000. We think shares are worth somewhere between $25 and $45 per share.
Lumber Liquidators was our largest loss this quarter as shares fell from $12 to $8 following their release of very bad quarterly numbers. The company had been on the road to recovery as recently as the first quarter, but their rebound stalled as Floor and Décor and Home Depot continue to take share. They also suffered from poor product assortment as Laminates and Bamboo flooring fall further out of favor. After the quarterly call, it became clear to us that any recovery is much further out in the future and it might not come fast enough to offset competition from Home Depot, Lowes, or Floor & Décor. It was the only company in our portfolio that delivered worse than expected results across the board. We have exited our position.
Energy continues to weight on the portfolio as 3 of our top 5 detractors are from the energy sector: Transocean, Grand Tierra, and ROAN Resources.
Unfortunately, ROAN may become a permanent loss. A majority shareholder with 52% of the shares has offered to buy the company for only $1.52 per share, and amazing the Board agreed. Quite frankly we are getting robbed as this offer is at a substantial discount to the real value of the company. Even in a low-price oil scenario the value is close to $6 per share. The transaction works out to a valuation of just $1,000 per acre, which is a pittance. Other transactions in the same shale basin have been between $6,000-$10,000 per acre.
The buyer intends to flip the company and make a quick profit. They have directed ROAN management to halt all oil field development. We suspect they have also lining up private transactions to sell the company in pieces at substantially higher prices. Public E&P’s didn’t want to face scrutiny from paying a 300 or 400% premium for another public peer, even if it was a fair value. By selling ROAN in smaller private land transactions, the publicly traded suitors won’t face the scrutiny that they would have if they had bought out the entire publicly traded company.
It is not clear to us if Elliott Management, a significant ROAN shareholder, is part of this plan or not. They usually don’t take too kindly to being ripped off, so there could be a situation where they bid a higher price and sell the assets themselves. In fact, the stock is trading just a penny below the offer price at $1.51. We suspect the lack of a premium is because some investors think this could be a potential outcome. We will wait and see.
There was a lot of activity in our holdings this quarter. We exited Maxar Technologies on success. The company had jumped sharply on some contract wins with NASA as the rest of the market was falling, so we felt it was a good time to take our gain and potentially wait for a better price if the stock rolled over again.
The increasing market volatility also led to our decision to raise cash. We sold the companies in our trading portfolio and emerging market stocks including Turkcell and Attento. We similarly sold Eagle Bulk Shipping, NN Inc, Intrepid Potash and Overseas Shipholding as these firms are more exposed to weakening global manufacturing data that has emerged over the last several months. We believed these companies were most at risk to seeing their recoveries stall. We will not be averse to rebuying these names if the non-US economic outlook improves.
The only new company we acquired in the quarter is Endo Pharmaceuticals. We built a small 3% position at $3 per share and placed the stock in our Tier 2 bucket. Endo is a generic drug manufacturer who has too much debt and has been entangled in the opioid crisis.
In the last year, shares of Endo have fallen approximately 80% and trade for only 1x earnings. Endo had already been under pressure since 2016 as the generic drug business struggled under an industry-wide pricing war initiated by low cost Indian and Chinese generic drug competitors. The stiffer competition was compounded by a lack of new drugs coming off patent which typically generate the highest generic margins for producers. The company has been able to stabilize their generics business, and recently introduce new drugs with higher profit margins and less competition.
In the last several months, Endo has been under intense scrutiny as the opioid scandal and pending litigation has exploded on the national stage. It has been compared by many to the tobacco settlement in the1990s. Endo did make and distribute a generic opioid based painkiller that has exposed the company to significant liabilities. Many of the analyst estimates I have seen for the opioid litigation liability are between $1.5-$2 billion. However, many of the recent settlements have been smaller than initial estimates that could result in a lower liability than most are forecasting.
Even if the final opioid liability does turn out to be $1.5 billion, it will ultimately be paid out over many years from existing reserved cash balances. As the generics business profitability improves or the company sells assets, they should also be able to generate enough cash to meet their $1.6 billion in debt that matures in 2023. After repaying those bonds we believe they would be able to refinance the remainder of their notes that come due in 2025 and 2027.
Simply, Endo is priced for bankruptcy. The stock has been liquidated by institutional investors as they flee the opioid crisis. We believe it is premature to assume the worst as early settlements have been favorable, and as we described above, there is a path to recovery and debt paydown that is not incorporated in the stock price. The institutional liquidation of Endo is likely overdone, and we think we have time and optionality on our side for the opportunity to generate an attractive return for the risk we are taking.
Finally, we wanted to revisit the investment philosophy of the Phoenix Fund. The portfolio takes advantage of structural biases against institutional ownership of financially levered companies with low-stock prices. We seek companies that have had their stock prices fall 70% or more in the last two years and are priced below $10 dollars per share. This outcome typically leads to forced selling from their institutional shareholders, creating the opportunity to make outstanding investments for less constrained investors.
Generally, these companies are under distress from poor performance caused by what we believe are temporary factors. These companies typically have elevated levels of debt, and any prolonged period of business stress could cause stockholders to endure substantial losses. The Phoenix Fund is a high-risk, high-return investment strategy. Please see the Risk of Loss Section of Part 2A of Form ADV referenced below.